Chat now with support
Chat with Support

Foglight for Sybase 5.9.5.10 - User and Reference Guide

Using Foglight for SAP ASE
Exploring the SAP ASE Dashboards About the Sybase_MDA Agent About the Sybase_RS Agent Generating SybaseMDA Reports
Reference

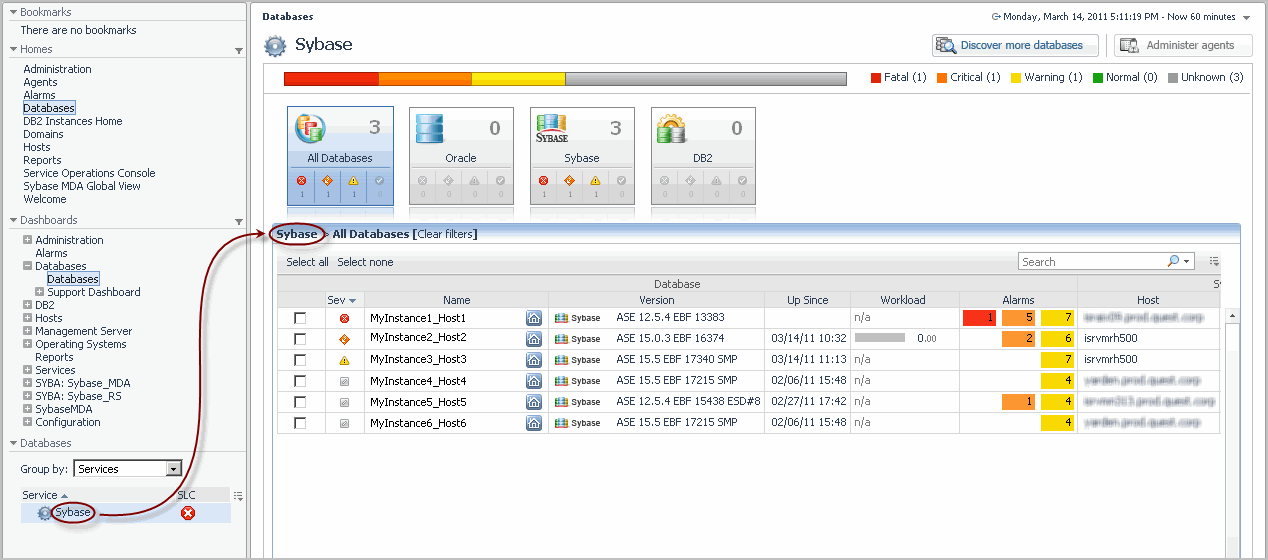
Managing database groups

In large monitored environments that include a high number of database instances it might be useful to create separate groups of database instances that share some common attributes, and to monitor the individual groups separately. Using the Databases view on the navigation panel, it is possible to group database instances either by identifying specific database instances, or services that contain specific database objects, and adding them to the group. This view allows you to create, edit, and remove database groups, thereby serving as a filter for the list of database instances.

When grouping database instances by services, you first need to associate the database instances with services and then identify the services that contain one or more objects used by the monitored databases. For more information about services in Foglight, see the Foglight User Help.

2
On the navigation panel, under Databases, click the box on the right of Group by and choose Services.
The Databases view refreshes, showing groups of monitored resources created using the Service Builder dashboard, and containing the Foglight for SAP ASE database topology. The SLC column, also appearing in this view, indicates the current availability of each service over a given period of time.
1
On the navigation panel, under Databases, select Database Groups and click .
The Add Sub Group dialog box appears.
2
In the Name box, type the name of the sub-group. Optionally, provide the sub-group’s description in the Description box.
3
Select one or more database instances in the Available list and click to move them to the Selected list.
TIP: To remove database instances from Selected, use and , as required.
4

Exploring the state of selected database instances

Clicking a database instance in the databases table opens a cue card, which gives you more details about the selected database.

Figure 45. Cue Card details

The cue card displays the following information.

Specifies the type of the monitored database instance.

The length of time between data samples.

The time when the last data sample occurred.

The number of Fatal alarms associated with the selected database instance.

The number of Critical alarms associated with the selected database instance.

The number of Warning alarms associated with the selected database instance.

The number of engines associated with the selected database instance that are currently online.

The amount of physical memory available to the selected database instance.

The number of connections handled by the selected database instance.

The number of processes associated with the selected database instance that are currently taking place.

The percentage of average engine utilization.

The percentage of the host’s CPU usage.

The amount of memory consumed by all OS processes (including the database instance process). This includes both RAM resident memory and swapped memory.

The number of devices associated with this database instance.

The number of databases running on the host.

The total amount of the space allocated to the devices.

The percent of the space allocated to the devices that is currently being used.

The wait time for this event in seconds plotted over time.

Links to the MDA Home Page Dashboard.

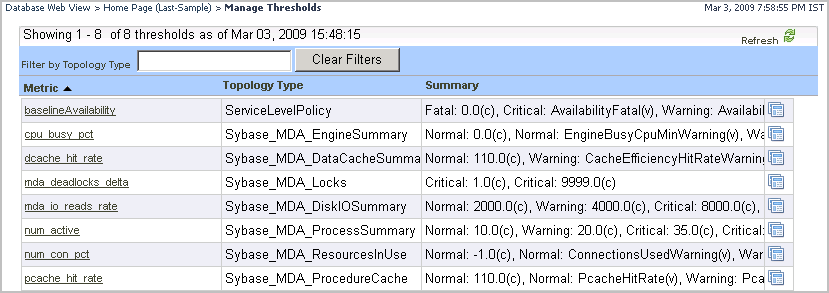
Manage Thresholds Dashboard

The Manage Thresholds dashboard provides access to the list of thresholds. A topology filter is available to search for a specific set of thresholds. For more information about this dashboard, see the Administration and Configuration Help.

Metric

The metric threshold name. You can edit a threshold by clicking on this name.

Topology Type

The topology type to which this threshold is assigned.

Summary

The summary of the threshold properties.

About the Sybase_MDA Agent

The Sybase_MDA Agent monitors the performance of the Sybase Adaptive Server Enterprise 12.5.1 and above. A unique characteristic is the ability for a user to select a “monitoring level” (called Availability Performance and Diagnostic). Each level is associated with a group of tables and their associated collection. By default, Availability and Performance tables are activated and all others are turned off. You can optionally select or clear Configuration, Performance or Space Trending to tune the agent to collect the metrics important to your environment.

In addition, all tables that can return multiple rows have a corresponding entry in the agent properties to limit the incoming data (see the Data Retrieval properties). The Limit Incoming Rows property displays a set of criteria developed to limit the amount of data written to the Foglight database. These values are used strictly to manage the amount of data written to the Foglight database and NOT to configure the Rules. Rules are still configured by registry variables.

Related Documents

The document was helpful.

Select Rating

I easily found the information I needed.

Select Rating