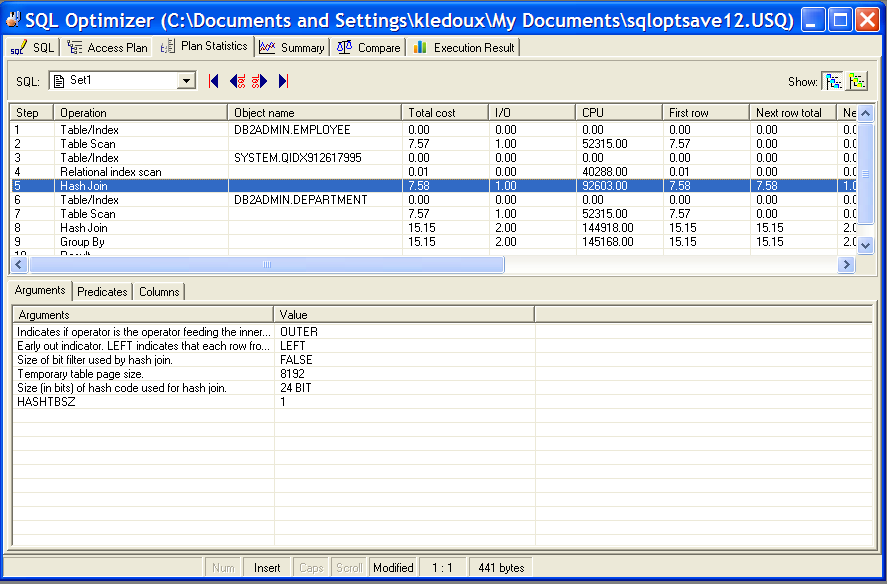
The Plan Statistics tab in the SQL Optimizer window displays the cost for each step in the access plan for the currently selected SQL or index-set alternative, along with the plan's arguments and values, its predicates, and the columns involved in the data stream.
The Cost Statistics pane provides detailed descriptions of each operation used in the access plan.
The following statistics are shown for each row of the access plan:
| Statistic | Description |
|---|---|
| Buffers | The estimated cumulative number of logical read requests for data pages that have gone through the buffer pool. This value is expressed in 4KB page units. |
| Communication | The estimated cumulative communication cost of executing the access plan up to and including the operation specified in the selected step. This value is expressed in TCP/IP frame units. |
| CPU | The estimated cumulative number of CPU instructions required to execute the access plan up to and including the operation specified in the selected step. |
| First row | The estimated cumulative cost of fetching the first row of data for the access plan up to and including the operation specified in the selected step. This statistic is expressed in timeron units. |
| First row comm. | The estimated cumulative communication cost of fetching the first row of data for the plan up to and including the operation specified in the selected step. This statistic is expressed in TCP/IP frame units. |
| I/O | The estimated total number of I/Os required for the access plan, up to and including the operation specified in the selected step. This value is expressed in units of 4KB pages. |
| Next row CPU | The estimated cumulative number of CPU instructions required to fetch the second row of data for the plan up to and including the operation specified in the selected step. |
| Next row I/O | The estimated cumulative number of I/Os required to fetch the second row of data for the plan up to and including the operation specified in the selected step. This statistic is expressed in timeron units. |
| Next row total | The estimated cumulative cost of fetching the second row of data up to and including the operation specified in the selected step. This statistic is expressed in timeron units. |
| Object name | The name of the table, view, or alias involved in the operation. |
| Operation | A brief description of the operation performed on the data, as specified in the selected access plan step. |
| Remote comm. | The estimated cumulative communication cost of executing the remote access plan up to and including this operator. This statistic is expressed in TCP/IP frame units. |
| Remote total | The estimated cumulative cost of performing operations on a remote database for this access plan up to and including the operation specified in the selected step. This statistic is expressed in timeron units. |
| Step | The number of the step within the sequence of steps performed in the access plan. |
| Total cost | The estimated cumulative cost of executing the access plan up to and including the operation specified in the selected step. This statistic is expressed in timeron units. |
To see the Argument, Predicate, and Column information for a specific step
The Arguments tab lists the arguments and their values that are used in the access plan operation highlighted in the Statistic pane.
The Predicates tab provides information about the SQL predicates that the operation highlighted in the Statistic pane is processing.
The following information shows for each predicate:
The text of the predicate as interpreted by the SQL compiler.
The estimated fraction of rows that the predicate qualifies.
The label specifying how the predicate is used in the operation:
| Value | Description |
|---|---|
| JOIN | Used to join tables |
| RESID | Evaluated as a residual predicate |
| SARG | Evaluated as a sargable predicate for index or data pages |
| START | Used as a start condition |
| STOP | Used as a stop condition |
The label specifying when the subquery used in this predicate is evaluated:
| Value | Description |
|---|---|
| blank | The predicate does not contain a subquery. |
| EAA | (Evaluated at application) The subquery is re-evaluated each time the operation applies the predicate to a row. |
| EAO | (Evaluated at open) The subquery is evaluated once for the operation. The subquery results are reused each time the operation applies the predicate to a row. |
| MUL | (Multiple) More than one type of subquery exists for this predicate. |
The label specifying the type of relational operator used in the predicate:
| Value | Description |
|---|---|
| blank | Not applicable |
| EQ | Equals |
| GE | Is greater than or equal to |
| GT | Is greater than |
| IN | Is in list |
| LE | Is less than or equal to |
| LK | Is like |
| LT | Is less than |
| NE | Is not equal to |
| NL | Is null |
| NN | Is not null |
The flag indicating whether or not the predicate requires a data stream from a subquery:
| Value | Description |
|---|---|
| N | No subquery stream is required. |
| Y | One or more subquery streams are required. |
The Columns tab lists the table columns involved in the data stream for the access plan operation highlighted in the Cost Statistics pane.
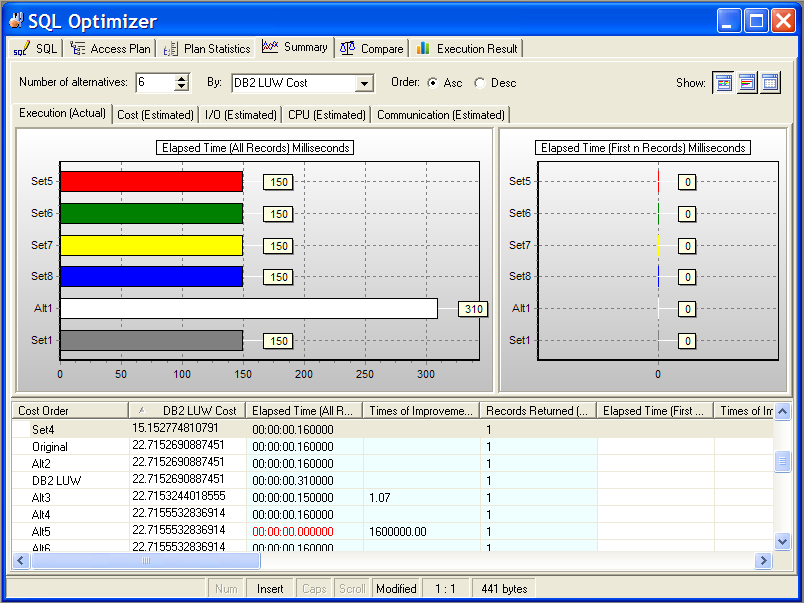
The Summary tab in the SQL Optimizer window displays the Run Time information and the cost estimates from various perspectives.
The Run Time pane displays the run time statistics for retrieving all records and for retrieving the first record.
Cost statistics shown on the Summary tab are estimated cumulative costs across all operations used in the access plan.
|
Item |
Description |
|
Buffers |
The estimated cumulative number of logical read requests for data pages that have gone through the buffer pool. This value is expressed in 4KB page units. |
|
Communication |
The estimated cumulative communication cost of executing the access plan up to and including the operation specified in the selected step. This value is expressed in TCP / IP frame units. |
|
CPU |
The estimated cumulative number of CPU instructions required to execute the access plan up to and including the operation specified in the selected step. |
|
First row |
The estimated cumulative cost of fetching the first row of data for the access plan up to and including the operation specified in the selected step. This statistic is expressed in timeron units. |
|
First row comm . |
The estimated cumulative communication cost of fetching the first row of data for the plan up to and including the operation specified in the selected step. This statistic is expressed in TCP / IP frame units. |
|
I/O |
The estimated total number of I/Os required for the access plan, up to and including the operation specified in the selected step. This value is expressed in units of 4KB pages. |
|
Next row CPU |
The estimated cumulative number of CPU instructions required to fetch the second row of data for the plan up to and including the operation specified in the selected step. |
|
Next row I/O |
The estimated cumulative number of I/Os required to fetch the second row of data for the plan up to and including the operation specified in the selected step. This statistic is expressed in timeron units. |
|
Next row total |
The estimated cumulative cost of fetching the second row of data up to and including the operation specified in the selected step. This statistic is expressed in timeron units. |
The statistics from the grid are grouped together and displayed in charts.
To select how many records are displayed in the charts
Select the number from the Number of Alternatives list.
To select which statistic to use to select the records
Select the statistic from the By list.
To select the top or the bottom range of the statistic
Select Asc (Ascending) or Desc (Descending) from the Order option.
Use the pane-control buttons to reorganize the panes:
To display the statistics and charts
Click Chart and Statistics .
To display only the charts
Click Chart Only.
To display only the statistics
Click Statistics Only .
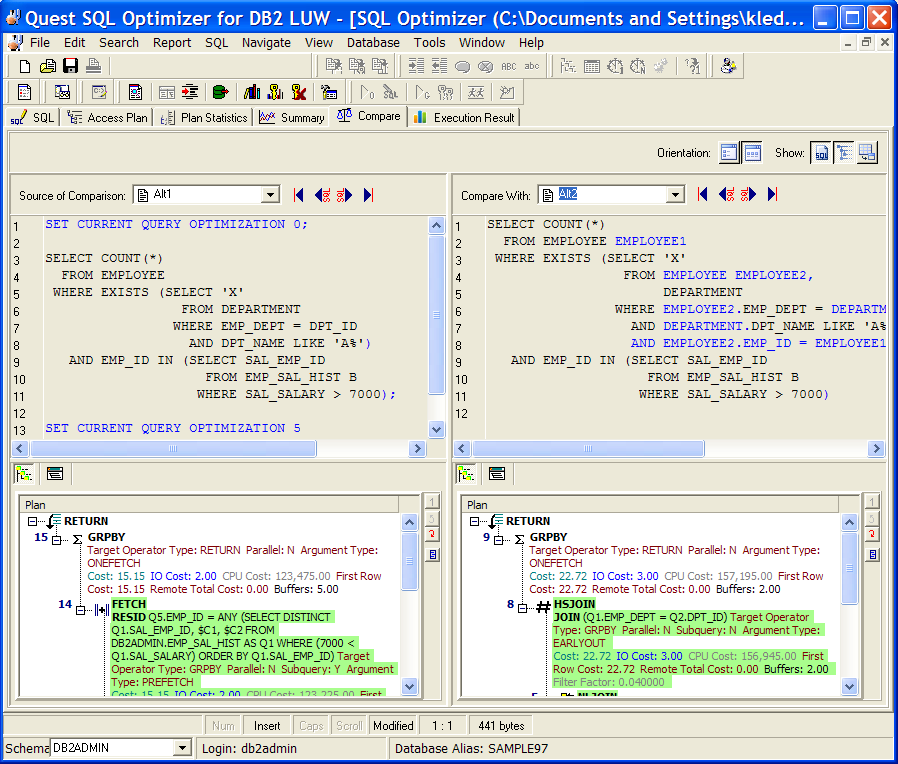
The Compare tab in the SQL Optimizer window enables you easily to compare SQL text, access plans, and statistics between two alternatives or between an alternative and the original SQL.
The Compare tab consists of two major panes—Source of Comparison and Compare With. Each pane shows information for one alternative. Differences in syntax and access plans are highlighted in either pane.
Use the pane-control buttons to reorganize the panes:
To display panes vertically
Click .
To display panes horizontally
Click .
To display or remove SQL Text panes
Click .
To display or remove Access Plan panes
Click .
To display or remove Statistics panes
Click .
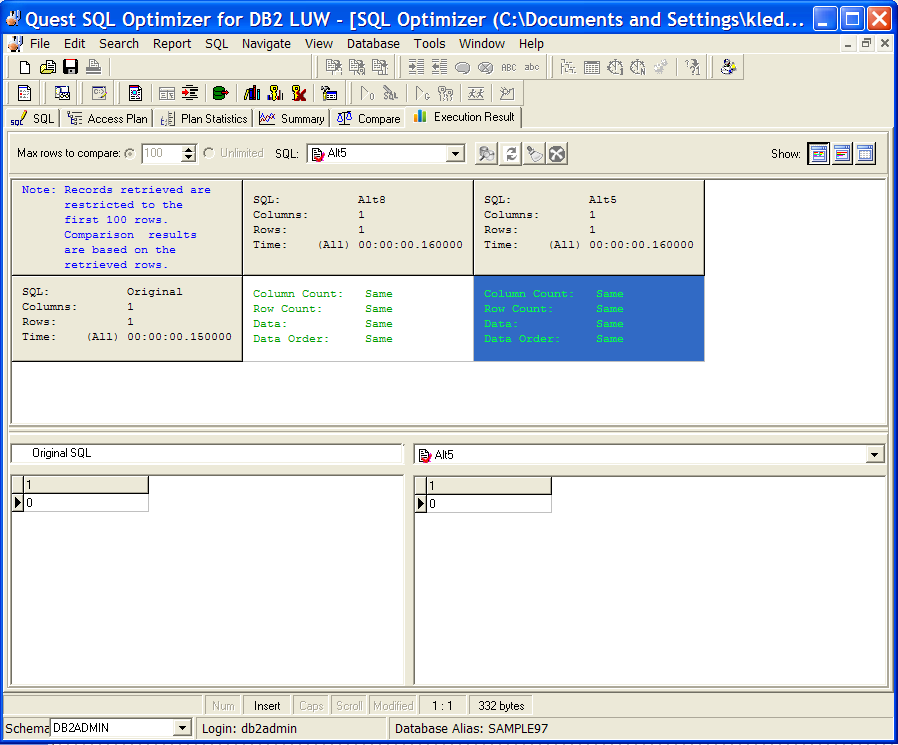
The Execution Result tab in the SQL Optimizer window compares the data returned by the original SQL with the data returned by any one of the SQL alternatives.
To compare all rows of data between the original SQL and an SQL alternative
 .
. To compare a limited number of rows between the original SQL and an alternative
. The grid in the top pane provides quick overview of returned-data differences. The numbers of returned columns and rows show whether the SQL alternative produces the same result as the original SQL statement. The displayed time shows how long it took to execute Batch Run or the Run Time, not the time it took to retrieve the data for the Execution Result tab.
Note: If the Data statistic shows that the returned data differs when you retrieve limited rows, do not assume that the alternative is returning wrong data. The difference can suggest that the alternative has returned data in an order different from the order returned by the original SQL. Two SQL statement are considered to be semantically equivalent if they retrieve the same data in any order (as long as the ORDER BY clause is not used in the SQL statement).
To refresh the data for the currently selected alternative
Click 
To clear all the data for original and all alternatives
Click 
To abort Compare SQL or Refresh SQL process
Click 

 View the Plan Statistics tab