
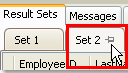
View Result Sets
The Result Sets tab displays a data grid for executed SQL statements and scripts that return data.
If you occasionally closed the Results pane, you can restore it by selecting Editor | Windows | Script Results.
Visual Inspection Grid
You can easily review all (or the selected Result sets) in one Result Sets tab. Left-click and hold Shift or Ctrl to select more than one Result sets of your script. Select All results to review all in one tab.
To enable view of all Result Sets in one Tab
- Check Options | Database | Script results | Enable all results view
Troubleshoot Data
- If you cannot edit data, click the red icon
in the lower left corner of the grid, and then click OK on the window that displays. You do not need to edit fields in this window.
- By default, auto commit is enabled and any row changes you make are automatically submitted to the database. You can disable this option in Tools | Options | Environment | Grid.
Tips for Working with Data
|
To... |
Do this... |
|---|---|
|
Pin a result set so it is not overwritten by a subsequent query in the Editor or Query Builder. |
Click the push pin beside the result set:
|
|
Set the value of a cell to null. |
Press CTRL+DELETE. |
|
Toggle between the Editor and Data Grid. |
Press F6. |
| Add column or group summary values |
Right-click the data and select Show | Summary Footer Panel. Then, right-click the Summary Footer Panel below the column you want to add a summary total to and select an option. If you have grouped columns using the Grouping panel (Show | Group Panel), you can also add a summary total to grouped records. |
|
Apply a summary function to the data (Sum, Min, Max, Count, Avg). |
Right-click below the column you want to apply the summary function (but above the Navigation toolbar) and select an option. |
|
Show or hide columns of data. |
Right-click a column heading in the data grid and select Column Chooser. |
|
Display data in a report, pivot grid, or chart. |
Right-click the data and select Send To |<option>. |
|
Compare differences between two data sets. |
Right-click the data and select Compare To. |
|
Display the data in a grid or card view; grid view is useful for viewing summary information at a glance; card view is useful for viewing information in greater detail. |
Right-click a record and select Show |Grid View or Card View. |
|
View multi-line text in the data grid as one-line text separated by spaces. |
Right-click the data and select Show | Multi-line Text as One-line. When the option is cleared, only the first line of the multi-line text is shown. To see the full text hover a mouse over a data grid or expand it. |
Compare Differences in Data
You can compare result sets from the current editor or a different editor in the Database Explorer's Data tab or the editor's Result Sets without having to save one of the sets to a file.
Notes:
- If you want to synchronize data, use Data Compare instead of the Data Diff Viewer.
- You cannot modify files in the Diff Viewer at this time.
To compare differences in data
-
Right-click data in the Editor's result set or Database Explorer's Data tab and select Compare To | Set_number.
You can also save a result set and later use it as a historical comparison.
-
Review the differences.
Tips:
- To switch the contents of the left pane to the right pane, and the contents of the right pane to the left, click
.
- You can also open files to compare by clicking
beside the drop-down list at the top of each pane.
- You can show or hide tables that contain equal records, different records, etc., at any time using the toolbar.
- To switch the contents of the left pane to the right pane, and the contents of the right pane to the left, click
Export Data with One Click Export
Use One Click Export to quickly export data to an Excel report. You can also export data and include a linked query in the file. A linked query lets you create a "live" Excel report that can be refreshed dynamically. Because a linked query contains the underlying SQL for a report, each time you refresh the report the query executes and retrieves the latest data. The dynamic nature of linked query reports makes them ideal for distribution to users who need to see changes to data on demand without waiting for new static reports to be distributed.

Notes:
-
Before you can export to Excel, the Primary Interop Assemblies (PIAs) for your version of Excel must be installed. Typically, the PIAs are installed automatically when you install Microsoft Office.
-
Use the Export wizard if you need to specify column delimiters and advanced field options when exporting data.
To export data in one click
-
Select the range of data to export or click any row in a data grid to export all data.
- Right-click the selected range or data grid and select Quick Export.
-
Select an export option. Review the following for additional information:
Icon
Option
Description
Excel File
Export data to an Excel file. The file is automatically saved under a default name in the default export folder.
CSV File
Export data to a CSV file (comma separated value file). The file is automatically saved under a default name in the default export folder.
HTML File
Export data to an HTML file. The file is automatically saved under a default name in the default export folder.
Excel Instance
Export data to an Excel instance. Data is copied to a clipboard, Excel is launched, and a worksheet is populated with data. You can save the worksheet under a name and folder you specify or save it in the default export folder.
Excel Instance at active cell
Export data to an active cell in Excel. First open Excel and select a cell. Then select the Excel Instance at active cell option.
Excel Pivot Table
Export data to an Excel pivot grid report. See the Excel documentation for information on creating a Pivot Table report with external data.
Excel Pivot Table at active cell
Export data to an active cell for an Excel Pivot Table report. First open Excel and select a cell. Then select the Excel Pivot Table at active cell option.
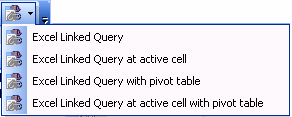
Excel Linked Query
Export the underlying query for data to Excel.
Excel Linked Query at active cell
Export the underlying query for data to an active cell in Excel. First open Excel and select a cell. Then select the Excel Linked Query at active cell option.
Excel Linked Query with pivot table
Export the underlying query for data to an Excel Pivot Table report. See the Excel documentation for information on creating a pivot grid report with external data.
Excel Linked Query at active cell with pivot table
Export the underlying query for data to an active cell for an Excel Pivot Table report. First open Excel and select a cell. Then select the Excel Linked Query at active cell with pivot table option.
Excel Column Chart Export data to an Excel chart instance. Data is copied to the clipboard, Excel is launched, and a chart is created with the data. You can then modify the chart's design and save the Excel file. Tip: To refresh data in a linked query report, click
in Excel's External Data toolbar. This executes the underlying query for the report. See Share Excel Linked Queries for more information about creating and using linked queries.


Note: If the window containing data does not have the focus when you select a One Click Export option, the following message displays: "Export did not find any results sets to process."
Tips:
- To specify a default export folder, go to Tools | Options | Environment | Export.
- To always open a Save File dialog when exporting using One Click Export, go to Tools | Options | Environment | Export and select the option. This allows you to always customize the file name.
Share Excel Linked Queries
You can use linked queries to create "live" Excel reports that can be refreshed dynamically. Because a linked query contains the underlying SQL for a report, each time you refresh the report the query is executed and the latest data is retrieved. The dynamic nature of linked query reports makes them ideal for distribution to users who need to see changes to data without waiting for scheduled updates or for new reports to be distributed.
Notes:
-
Any user who opens an Excel linked query must have access to a user name and password for the queried database to refresh the data. If a user does not have access to the database, they can only see the original data in the spreadsheet.
-
If the Excel linked query was created from an ODBC connection that uses a Data Source Name (DSN), the DSN must also exist on the computer where the Excel file is opened to refresh the data.
|
Scenario You need to create an Excel linked query so that the Regional Sales Manager, can track whether the Sales Representatives in his region meet their monthly and quarterly goals. By providing a linked query, you only have to create the query once, and then the Regional Sales Manager can refresh the data at any time to view the latest sales information. |
To create an Excel linked query
- Connect to the database.
- Create a query in the Query Builder or Editor.
- Execute the query to display data results.
-
Select the result set and click one of the following options from the toolbar:
- Save the Excel spreadsheet.
- Email or upload the spreadsheet to a shared network folder to share it with colleagues.
To refresh data in an Excel linked query
- Open the spreadsheet with the linked query in Excel. The original data from the query displays.
- In Excel, select Data | Refresh to update the original data with the current data.
-
If prompted, enter a user name and password to connect to the database and refresh the data.
or
If the following error displays: "[Microsoft][ODBC Driver Manager] Data source name not found and no default driver specified", you must specify the DSN used by the query on your computer. Complete the following steps to resolve this issue:
- Click OK.
- Select the Machine Data Source tab, and then click New.
- Use the wizard to select a User Data Source and create a DSN that points to the database.
- Click OK to return to Excel and open an ODBC Driver Connect window.
- Enter a user name and password to refresh the data.
 (Excel 2003)