Using Spotlight® on SAP ASE
The Main Spotlight® on SAP ASE Window
Spotlight® on SAP ASE’s unique user interface provides you with an intuitive, visual representation of the activity on a ASE connection.
This chapter describes the elements of the main application window, the alarms and drilldowns available, and a description of the SAP ASE architecture.
The Main Spotlight® on SAP ASE Window
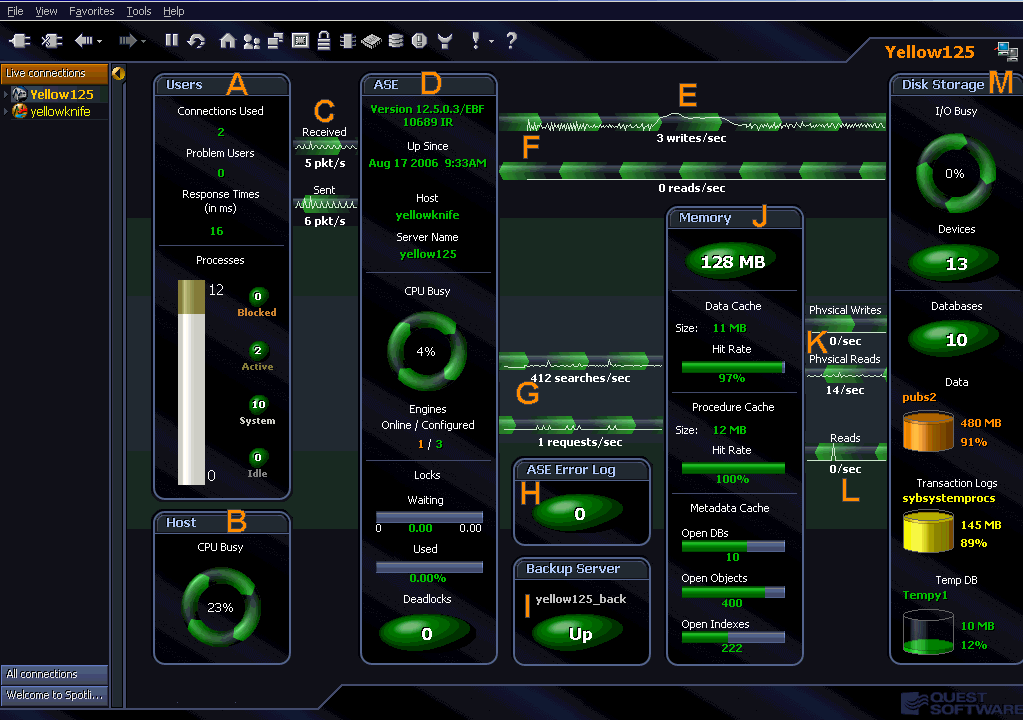
The main Spotlight® on SAP ASE window provides a quick and intuitive view of the activity of a ASE instance.
The Spotlight® on SAP ASE window helps you locate system bottlenecks quickly. Related server statistics are grouped together on panels that are connected by a series of graphical flows and icons. Spotlight® on SAP ASE updates these flows in real time so that you can see how quickly data is moving through the system. The icons change color as their values move through the range of thresholds.
The following graphic shows the main features of the Spotlight® on SAP ASE window. The list following the window identifies and describes each element.

| This Window Element… |
Shows… |
| A |
Users panel |
Number of user connections allowed by the current Spotlight® on SAP ASE instance.
Number of user processes that may potentially be problematic for system operations. Amount of time a sample SQL statement took to run.
Processes running on the Adaptive Server, including those blocked, active, and idle. |
| B |
Host panel |
This current level of activity for the host CPUs in the machine. The value is the sum of the usage by the system and users. |
| C |
Packets sent and received |
The current level of activity. As the rate of data transfer increases, so does the speed of the flow. If the statistic represented by the flow moves into another threshold, the flow may change color. The combination of movement and color makes it easy to spot congested areas. |
| D |
ASE panel |
Date and time Adaptive Server was started.
Name of the host machine on which the Adaptive Server is running.
Adaptive Server-related tasks (shown in two sections—CPU Busy and Locks.
Time spent on server-related tasks.
Engines online and configured.
Number of times a lock waited longer than the Lock Wait threshold.
Number of locks in use.
Number of deadlocks. |
| E |
Server Status |
Displays important information about the status of the server that affects Spotlight's ability to perform monitoring. |
| F |
Disk Writes/Disk Reads |
Information about how many disk writes and disk reads per second have been completed by the Adaptive Server. |
| G |
Data Cache/ Procedure Cache Searches |
Number of searches per second requested from the data cache.
Number of stored procedures requested per second. |
| H |
ASE Error Log panel |
The ASE Error Log panel displays the number of errors that match the severity levels that have been established for error log entries.
Severity levels are defined using the Spotlight® on SAP ASE Error Log Options window. |
| I |
Backup Server panel |
Status information for the Backup Server. |
| J |
Memory panel |
Information about the following:
Memory allocated to the Adaptive Server
- Data cache size
- Data cache hit rate
- Procedure cache size
- Procedure cache hit rate
- Metadata cache Open DBs
- Metadata cache Open Objects
- Metadata cache Open Index
|
| K |
Data Cache Writes/ Reads |
Number of buffers written from cache to disk, expressed as a rate per second.
Number of searches of the data cache that did not find the page in cache and required a disk read. |
| L |
Procedure Cache Reads
Disk Storage Panel |
The rate at which stored procedures are read from disk.
The Disk Storage panel has two main sections—I/O Busy and Databases. The I/O Busy section shows ASE performance of I/O-related tasks (as a percentage) and also the number of I/O disk devices.
The Databases section shows:
- Number of databases
- Size of the fullest database being monitored.
- Percentage of space used by the fullest database, along with a container representing this same data.
- Size of the fullest transaction log being monitored
- Percentage of space used by the fullest transaction log, along with a container representing this same data.
- Size of the fullest temp DB being monitored.
- Percentage of space used by the fullest temp DB, along with a container representing this same data.
|
Spotlight® on SAP ASE Alarms
Spotlight® on SAP ASE Alarms
Some of the main alarms that may appear on the Spotlight® on SAP ASE window are shown in the following table. For a full list of alarms, see “Spotlight® on SAP ASE alarms” in the online help.
| This alarm… |
is raised when… |
| Backup Server Status |
Spotlight detects an error when attempting to connect to the Backup Server. This checking is done by executing a remote server call from the connection to the Adaptive Server that Spotlight has established. Spotlight then dissects return messages from the Backup Server.
The Backup Server needs to be started by going to the host machine where the Backup Server is installed and running the appropriate shell or batch files for your environment. You are not be able to back up your database or dump your transaction logs until the respective Backup Server is up and running. |
| Blocked User |
The percentage of processes unable to run (waiting) because another process has a lock on a needed resource has exceeded the defined thresholds. |
| Connections Used |
The number of current user connections approaches the maximum number defined in the configuration variable number of user connections.
This value represents the number of connections found in the master..sysprocesses table.
If the number of connections used remains close to the maximum allowed on Adaptive Server, consider increasing the number of connections allowed.
There is a cost in memory associated with increasing this value (approximately 146K per connection, depending on the Adaptive Server version). |
| CPU Busy |
The percentage of time that the Adaptive Server’s CPU was performing Adaptive Server related tasks has crossed a defined threshold. |
| Database Status |
Raised at the following levels when Spotlight detects that the status of any database for the Adaptive Server is in one of the following states:
- Informational: Read Only, Database being Recovered, Database being upgraded.
- Low: DBO use only, Single user mode, Offline, Offline until recovery completes
- Medium: Database created for load.
- High: Suspect Database, Suspect pages.
|
| Data Cache |
The rate of searches requested from the data cache (expressed as searches per second) exceeds normal levels. |
| Data Cache Hit Rate |
The data cache hit rate for the server falls below the ranges defined by the thresholds on this component. |
| Deadlocks |
The number of server-side deadlocks detected on an Adaptive Server goes above normal volumes.
Deadlocks become more common as lock contention increases. |
| Disk Reads |
The rate of disk I/O for reads on an Adaptive Server (displayed as a rate per second) goes above normal levels. |
| Disk Writes |
The rate if disk I/O for writes on an Adaptive Server (displayed as a rate per second) goes above normal levels. |
| Engines Offline |
This alarm is raised when Spotlight determines an engine is offline. |
| Error Log |
Spotlight detects one or more lines written to the Error Log that match the configured patterns defined within Spotlight.
This alarm is only available with Adaptive Server version 12.5.0.3 and later. ﰀr |
| Fullest Database |
When any database exceeds the usage limits defined in the thresholds. |
| Fullest TempDB |
When any tempdb exceeds the usage limits defined in the thresholds. |
| Fullest Transaction Log |
When any database's transaction log exceeds the usage limits defined in the thresholds. |
| Host CPU Busy |
This alarm is raised when the percentage of time that the Adaptive Server's Host CPU has been performing tasks exceeds the defined thresholds.
By drilling down to the associated SoWin or SoUNIX plug ins, you may be able to identify and correct the cause of the high CPU usage. |
| I/O Busy |
The percentage of time that the Adaptive Server’s CPU was performing Adaptive Server I/O-related tasks has crossed a defined threshold.
If values are consistently high, it is likely that response time and throughput could benefit from additional devices or better distribution of I/O among multiple devices. |
| Locks Waiting |
The number of locks waiting to be granted is above normal levels. |
| Locks Used |
The number of locks used is above normal levels. |
| Open Databases Percent |
The percentage of open databases for the server (based on the number available) increases above the ranges defined by the thresholds on this component. |
| Open Indexes Percent |
The percentage of open indexes for the server (based on the number available) increases above the ranges defined by the thresholds on this component. |
| Open Objects Percent |
The percentage of open objects for the server (based on the number available) increases above the ranges defined by the thresholds on this component. |
| Problem User |
Spotlight detects a user that meets or exceeds the performance criteria defined in Spotlight as being of concern.
If this alarm is being raised too often, consider lowering the amount of activity level thresholds defined in Spotlight. |
| Procedure Cache |
The rate of searches requested from the procedure cache (expressed as searches per second) exceeds normal levels. |
| Response Time |
The amount of time a sample (or benchmark) SQL statement took to run exceeds normal thresholds. |
Spotlight® on SAP ASE Drilldowns
Spotlight® on SAP ASE Drilldowns
Drilldowns display detailed information about the database that you are diagnosing. Each drilldown contains a series of reports and graphs that provide you with specific information about the components of your database. The statistics that are available help you identify and anticipate performance problems.
| Drilldown Icon |
Use this drilldown… |
to access information about… |
 |
Alarm Log |
List of alarms, sorted according to time. Information includes the name of the component that issued the alarm, the date and time at which the alarm was logged, and the severity of the alarm. |
 |
Alarms by Time |
List of alarms organized into a Gantt chart. |
 |
CPU Summary |
Amount of time the Adaptive Server spends on server-related tasks and the number of engines configured. |
 |
Database Summary |
Number of databases.
Size of the fullest database, transaction log, and tempdb being monitored. |
 |
Device Summary |
Number of physical writes and reads per second completed by the Adaptive Server.
Percent of time spent by the Adaptive Server on I/O related tasks.
Number of disk devices.
Number of physical reads per second by the data cache.
Number of stored procedures read from the disk per second. |
 |
Error Log |
Error messages for the Adaptive Server you are diagnosing. |
 |
Locks Summary |
Locks shows a listing of users and the number of locks they are holding. |
 |
Memory Summary |
Memory usage for the Adaptive Server you are diagnosing. |
 |
Network |
Number of packets sent and received by the Adaptive Server. |
 |
Spotlight Monitoring Requirements |
General Adaptive Server, login, and machine information.
Settings for Adaptive Server Enterprise configuration elements.
Current Alarm Log, ASE Error Log, and Spotlight Error Log messages. |
 |
User Activity |
User connections, problem users, processes running on an Adaptive Server, SQL text capturing, and user wait events. |


