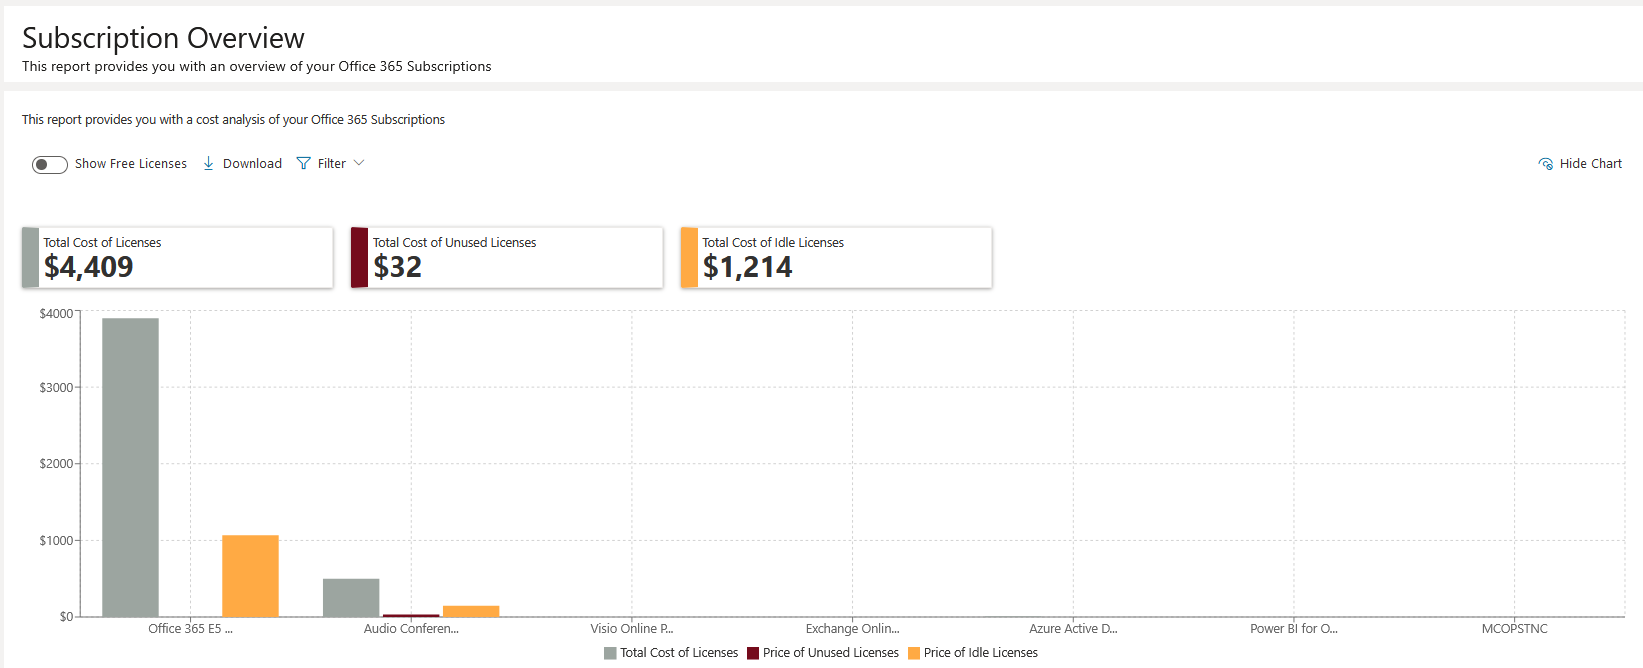
The subscriptions overview page allows you to get an overview of licenses which are consumed in an organization, and gives you the ability to configure price information so you can determine the cost of licensing to your organization. This includes licenses which are assigned, unassigned and are idle.
For more clarification on what total, assigned and unassigned units are:
·Total: Currently enabled licenses + suspended licenses
·Assigned licenses: Licenses consumed by users
·Unassigned licenses: Total number of licenses - assigned licenses
The dashboard provides an overview of licenses that are being used in the tenant. This includes a total cost of all licenses being used, including total costs of unused and idle licenses. You can download this chart in a .csv format, or filter the chart by organization and/or organization group.
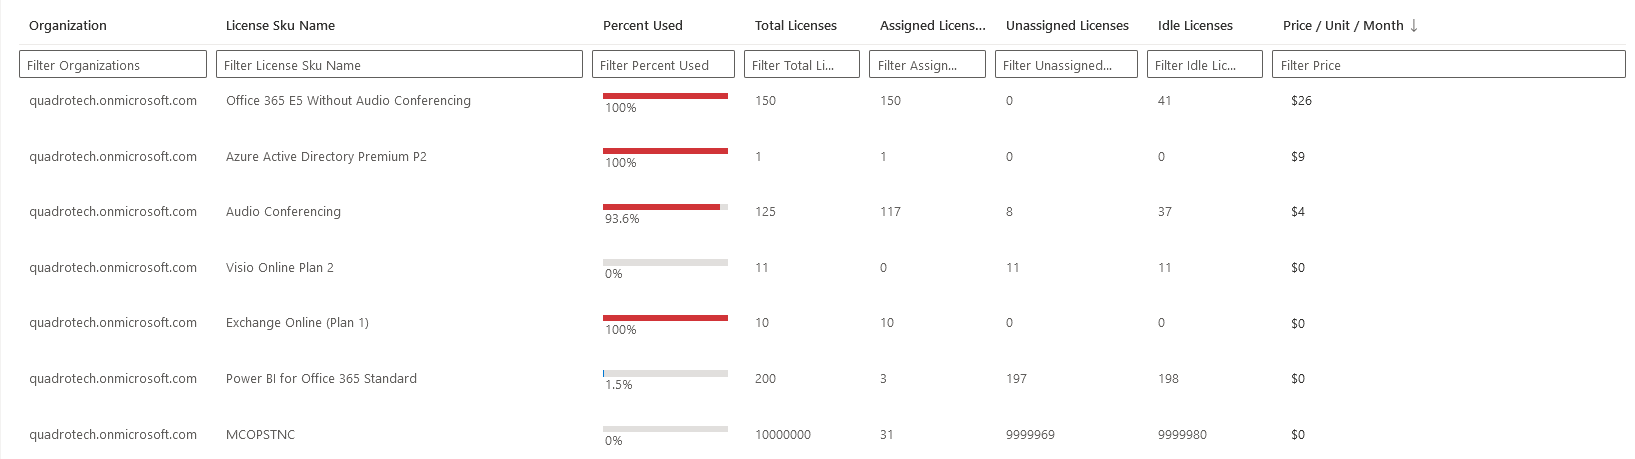
The table provides information on each license, including the percentage of licenses used, how many licenses there are and how many have been assigned, unassigned or are remaining idle.
The price associated with each license can be changed by clicking on it and entering the number.
Finding statistics on workload usage in easy to analyze graphs and charts is simple with Nova. In one screen, you can find data relating to a user's:
·Email usage
·Teams usage
·OneDrive for Business usage
·SharePoint usage
·Exchange Online usage
·Audit activity
·Mobile Device usage
and more.
To find this, search for the user in Nova's search bar, and click on the user you want to see statistics of.
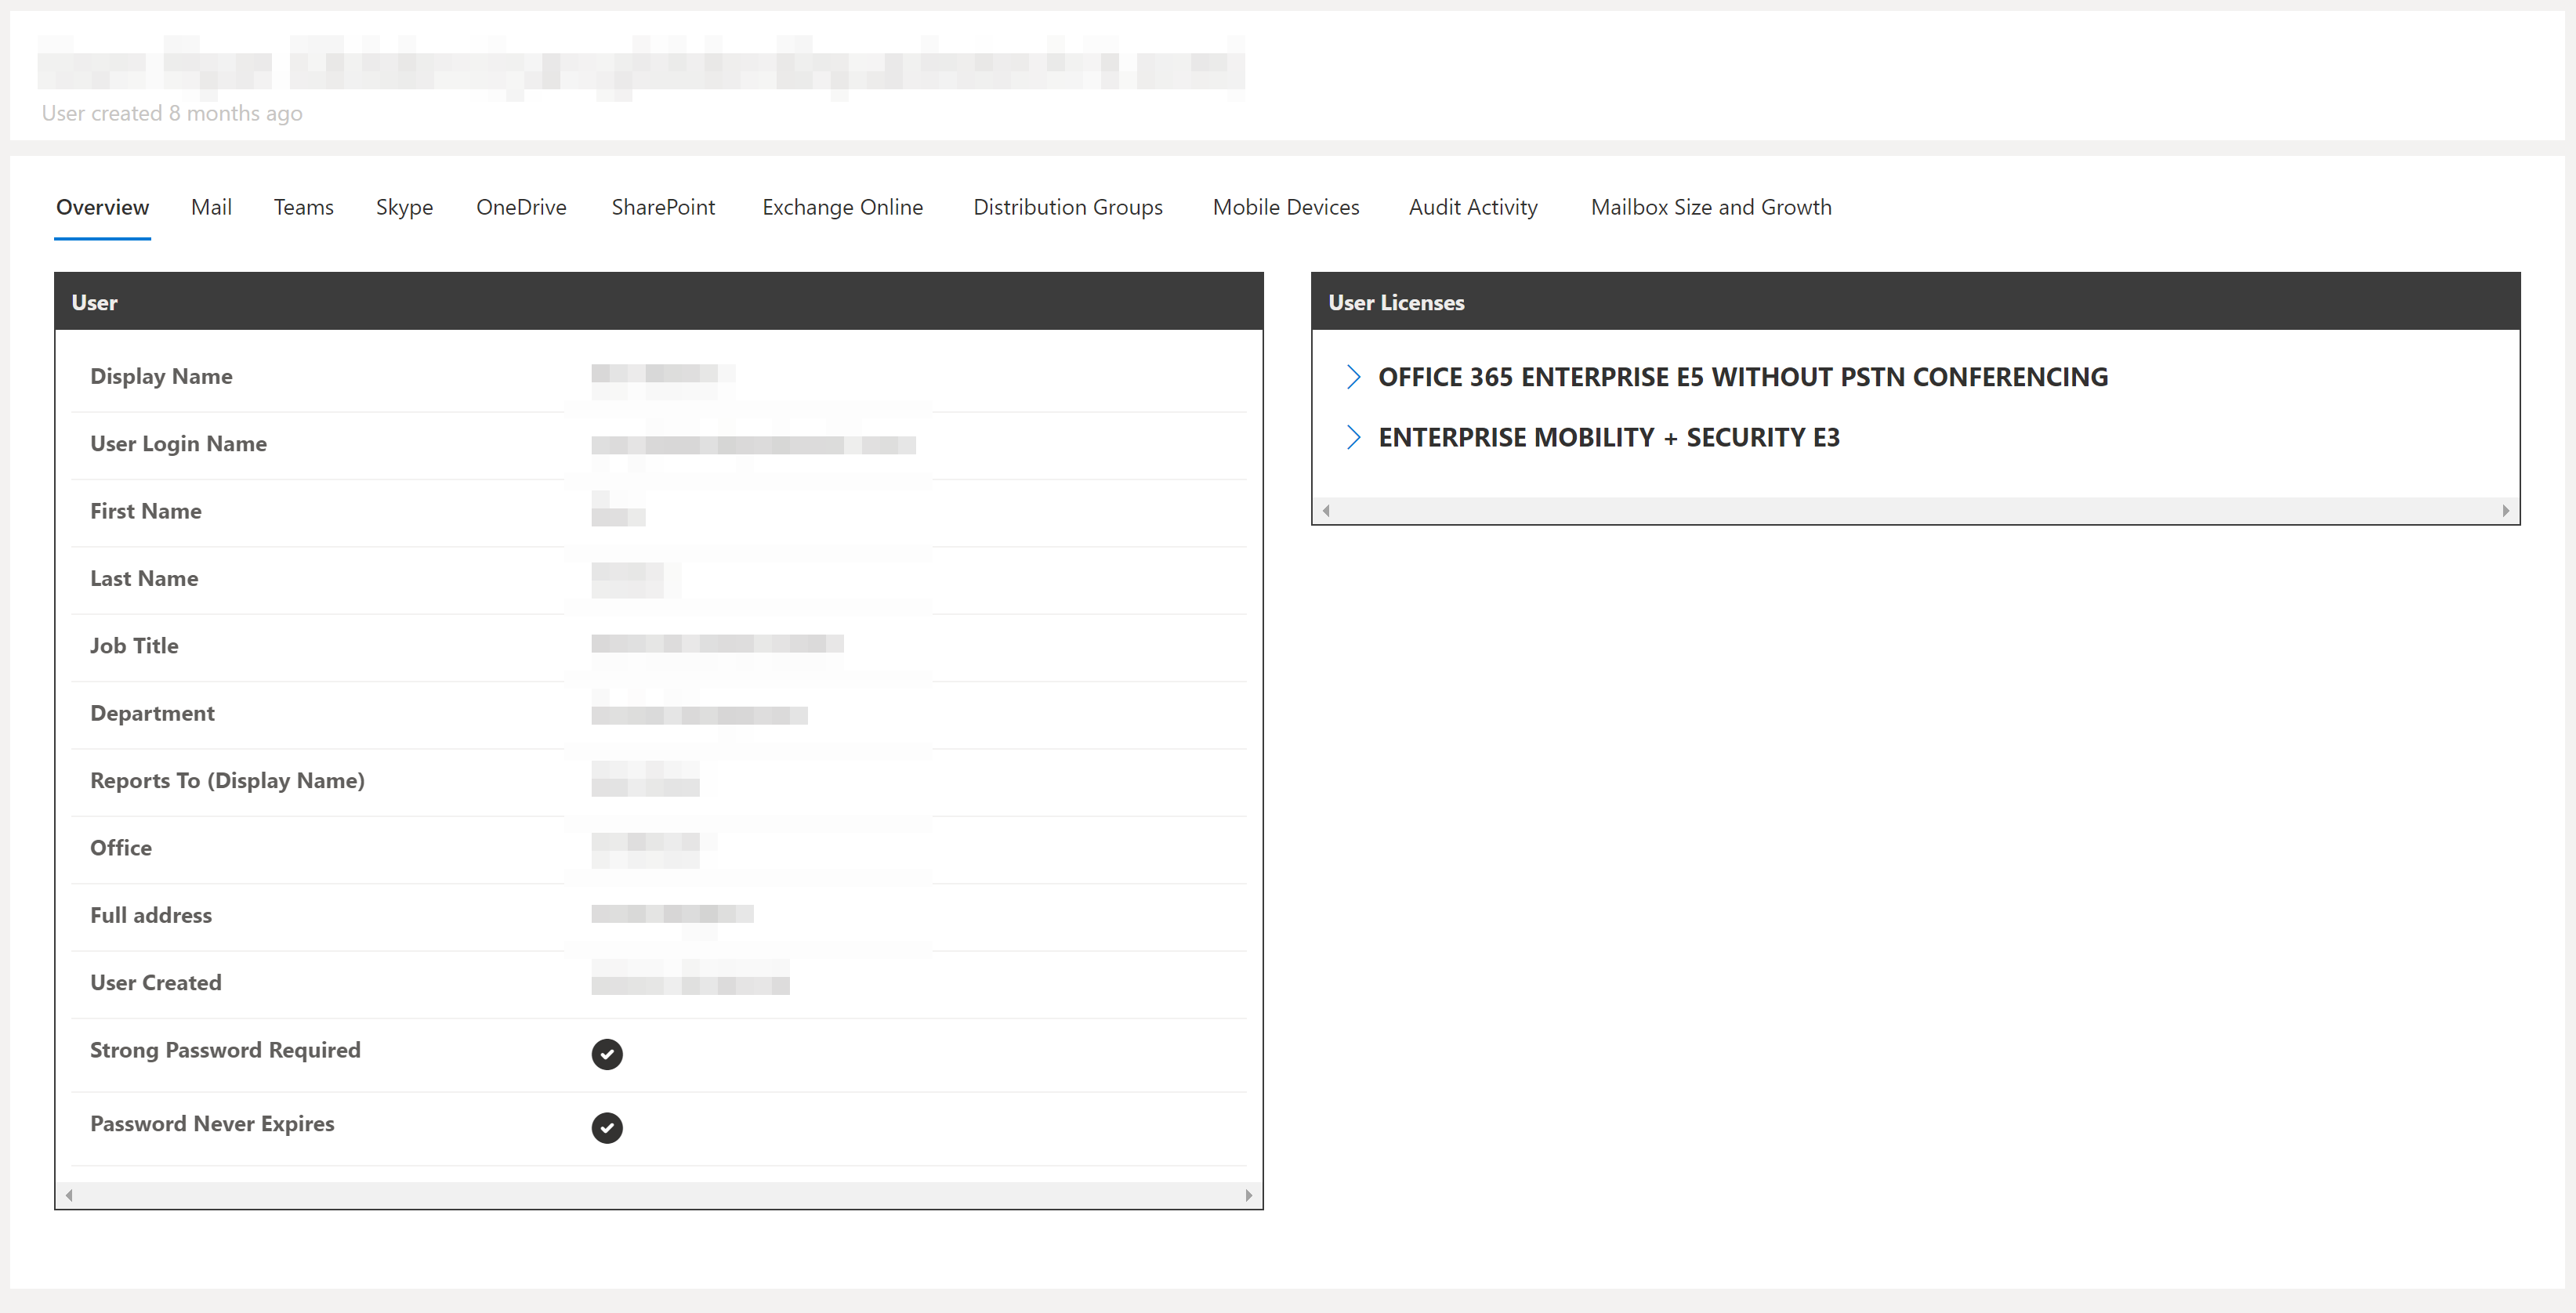
User overview
The user overview section gives you general information on that user, including:
·Name
·Job Title
·Department
·Manager
·Office
·Location
The screen also contains information on licenses that have been assigned to that user, including if that license has been successfully applied to that user or if it is pending.
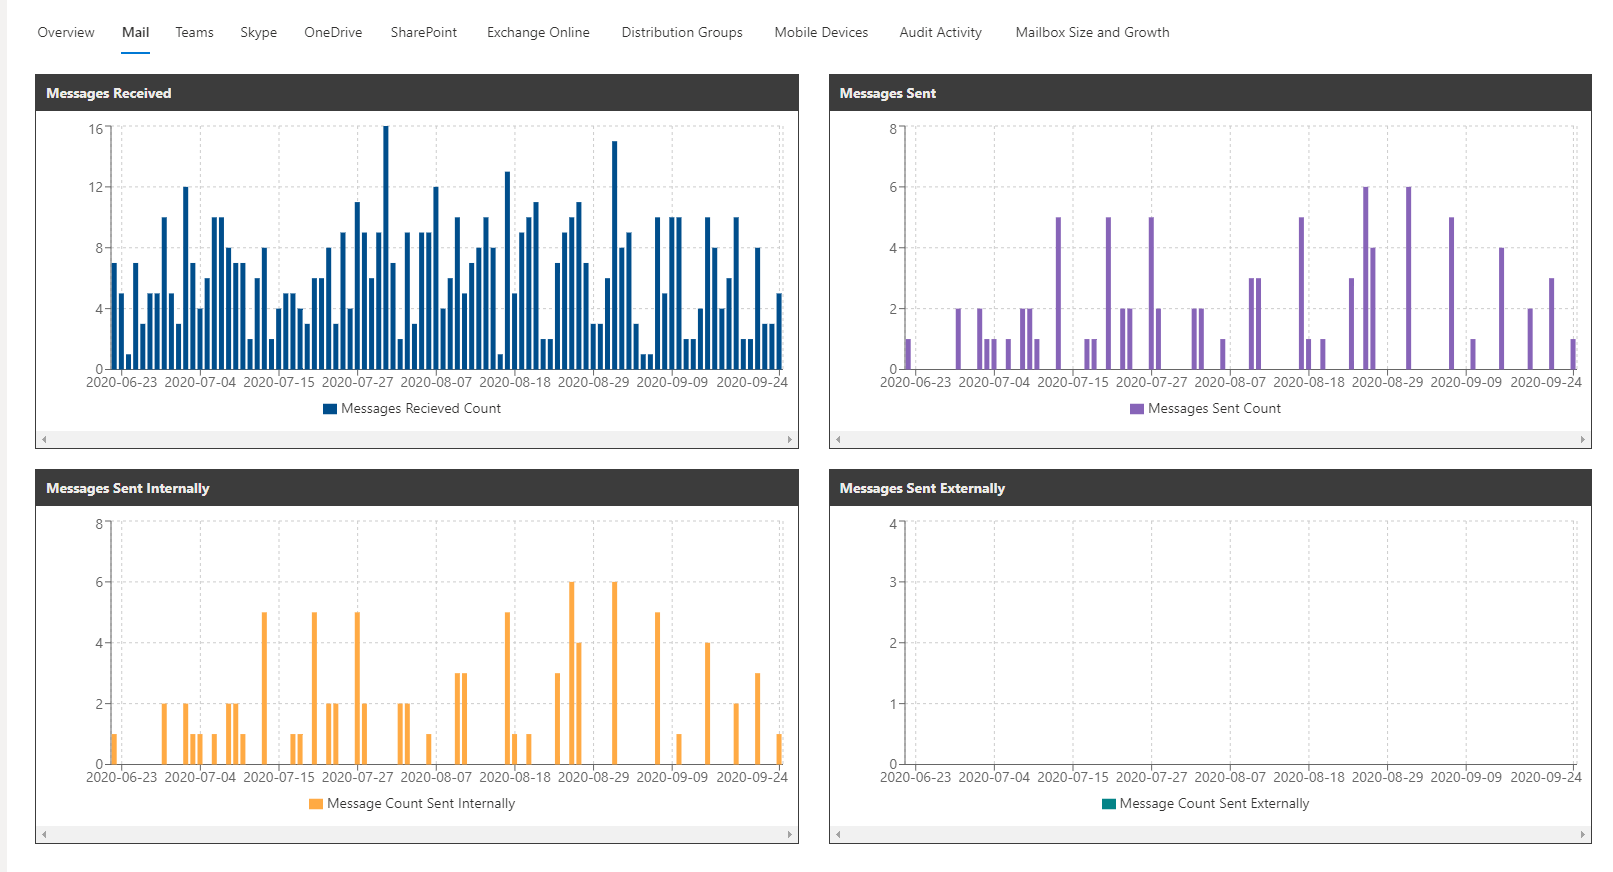
The mail tab gives you detail on the user's email activity over the past 3 months. This includes:
·Messages received
·Messages sent
·Messages sent internally
·Messages sent externally
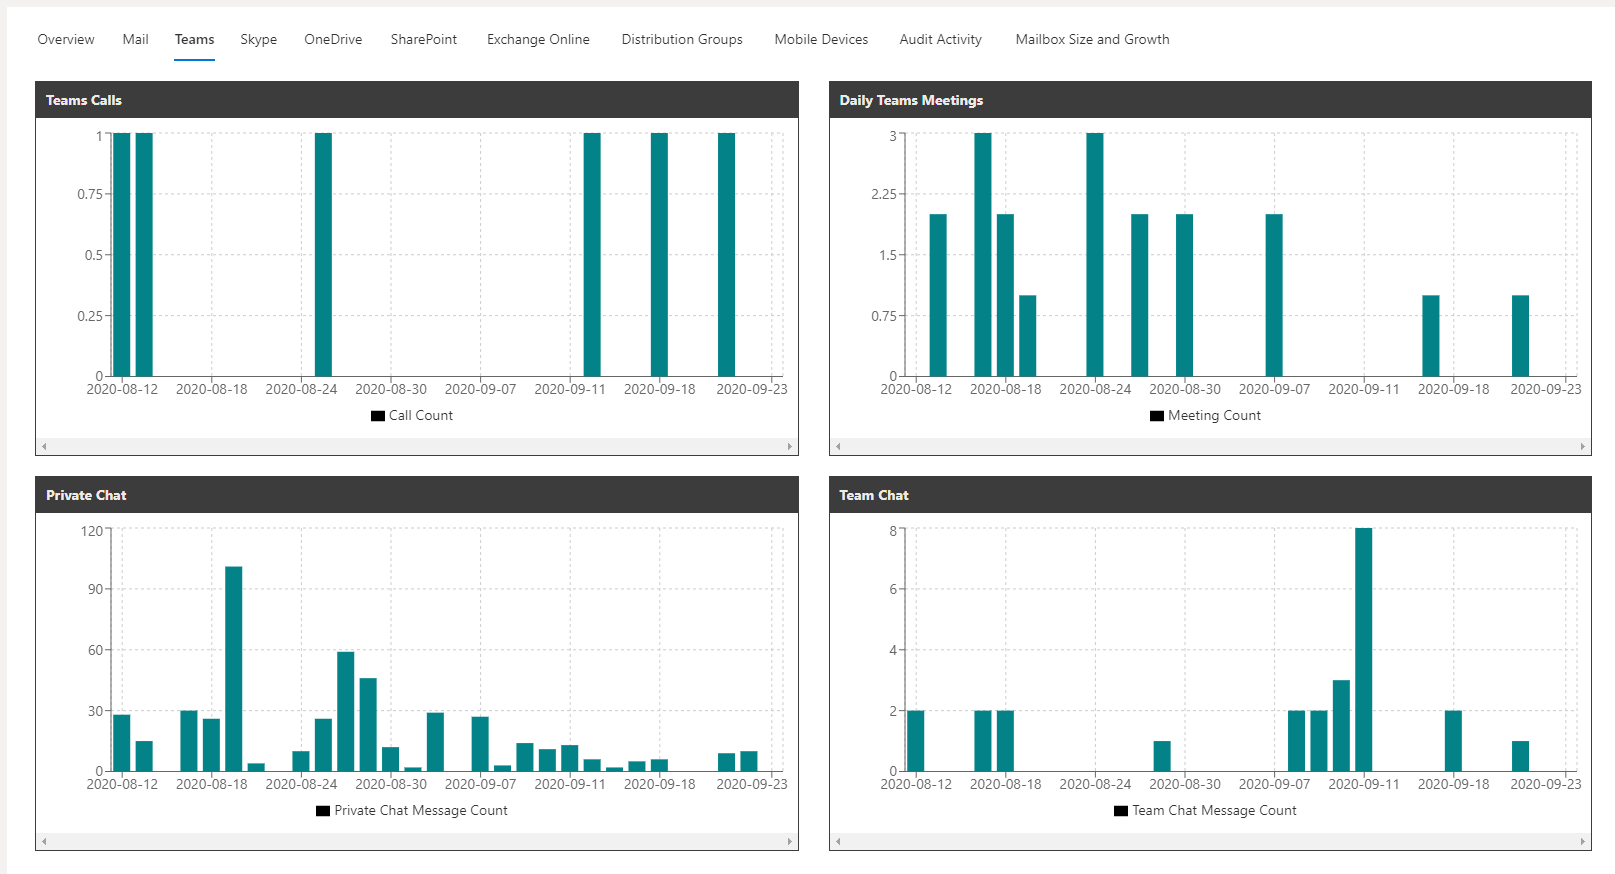
Teams
The Teams tab gives you detail on the user's Teams activity over the past month. This includes:
·Teams Calls
·Daily Teams Meetings
·Private Chat
·Team Chat
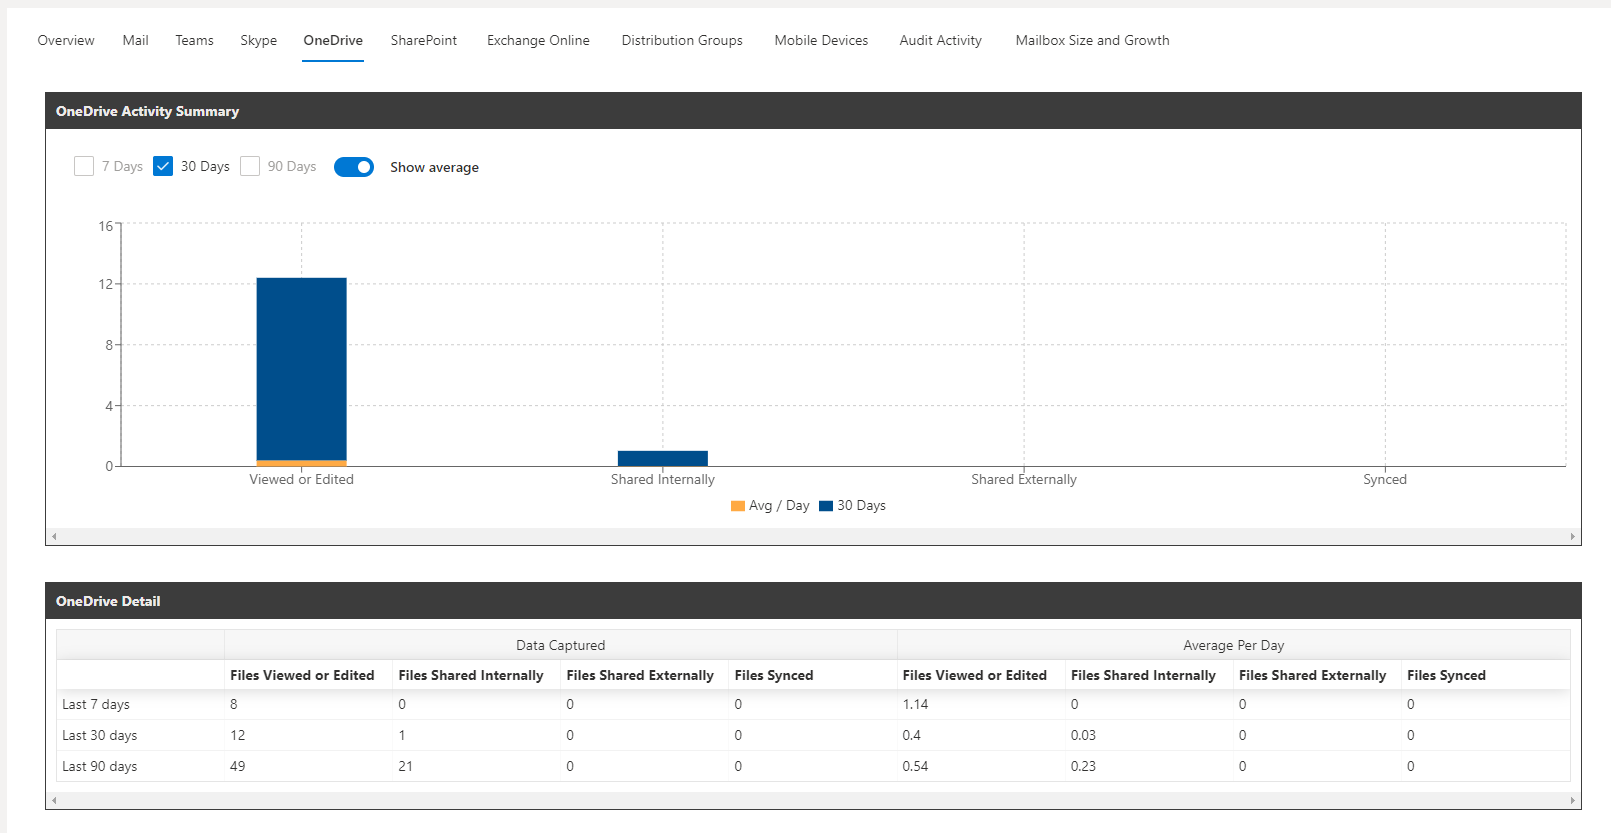
OneDrive
The OneDrive tab gives you comprehensive information on a user's OneDrive usage. See statistics within 7, 30 or 90 day parameters. Select 30 days, then show average to get a daily average total on activities such as:
·Files viewed or edited
·Files shared internally
·Files shared externally
·Files synced
Use the table to get exact data straight away, including average statistics on activity per day.
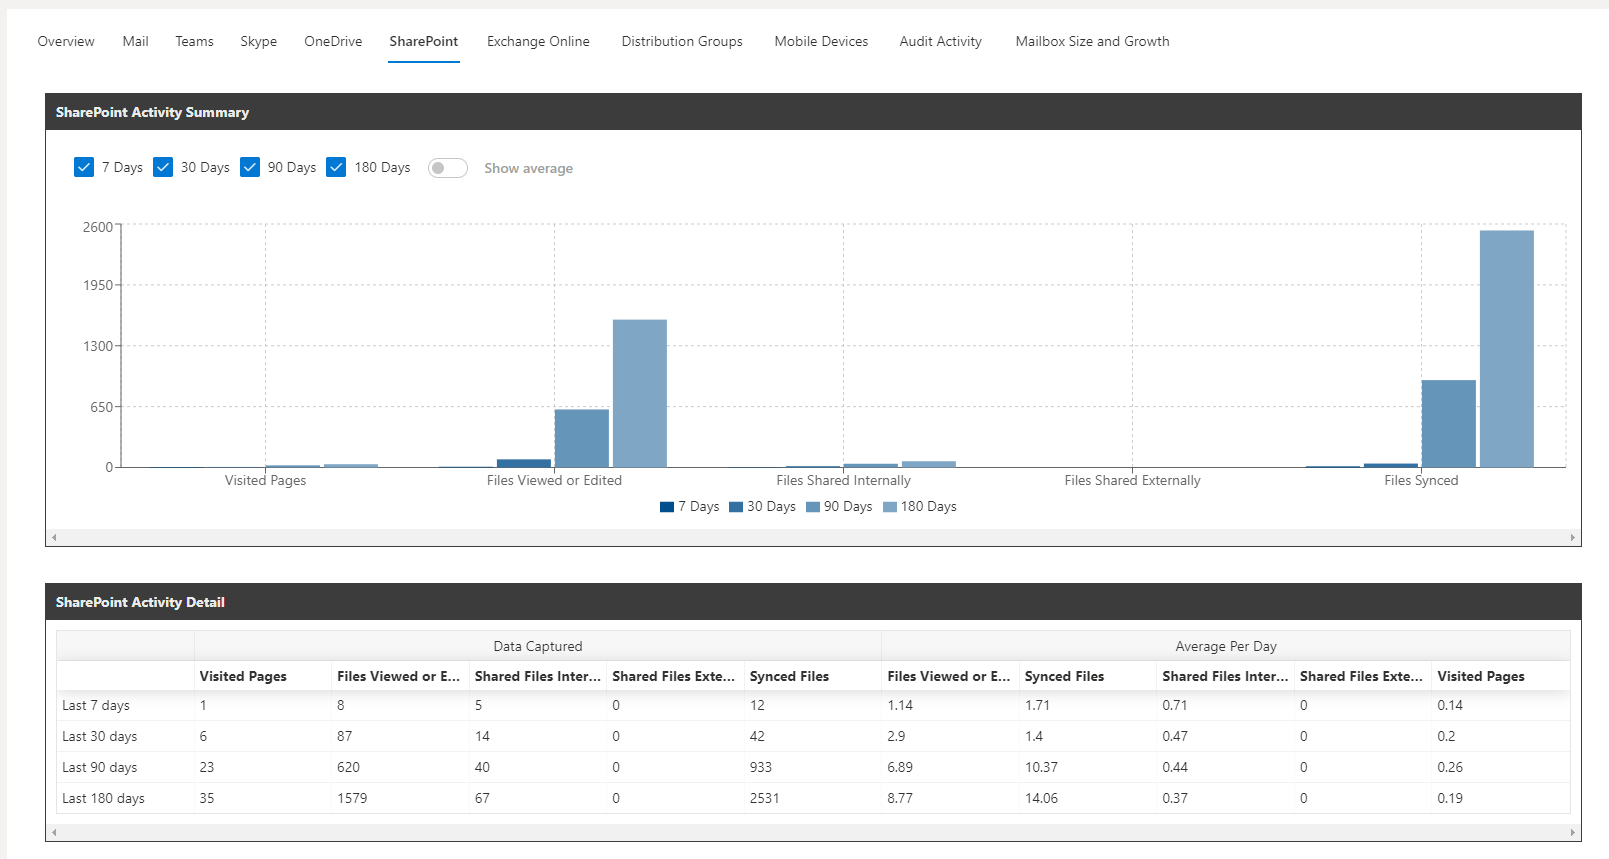
SharePoint
The SharePoint tab gives you comprehensive information on a user's SharePoint usage. See statistics within 7, 30, 90 or 180 day parameters. Select 30 days, then show average to get a daily average total on activities such as:
·Files visited
·Files viewed or edited
·Files shared internally
·Files shared externally
·Files synced
Use the table to get exact data straight away, including average statistics on activity per day.
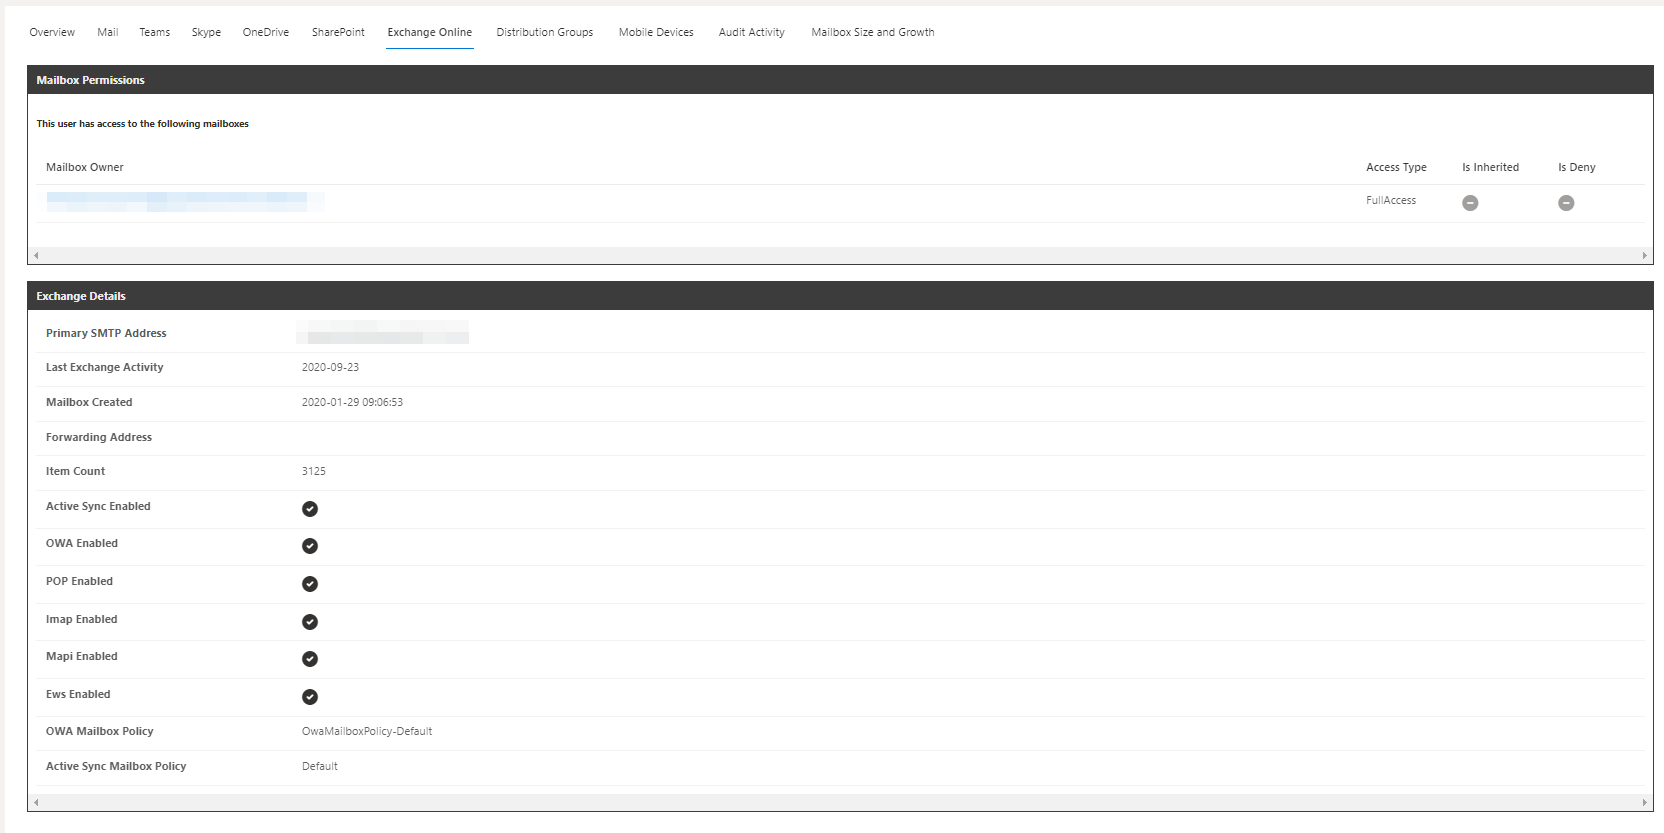
Exchange Online
The Exchange Online tab gives you information on details such as:
·access to specific mailboxes
·last Exchange activity
·when the mailbox was created
·Exchange item count
·enablement of services such as
·OWA (Outlook Web Access)
·Active Sync
·POP (Post Office Protocol)
·IMAP
·MAPI (Messaging Application Programme Interface)
·EWS (Exchange Web Services)
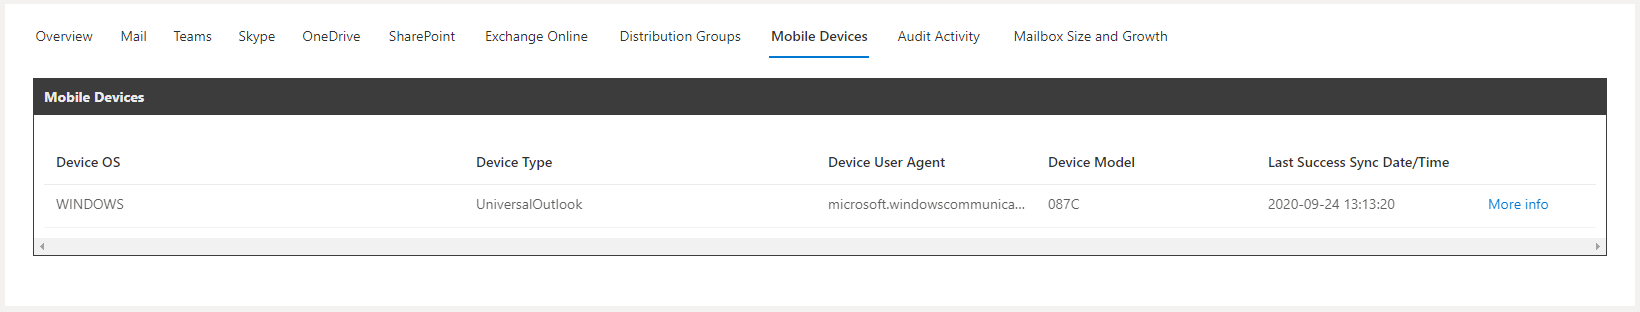
Mobile Devices
The Mobile Device tab gives you information on mobile devices affiliated with a user. Overview details include:
·Device OS
·Device Type
·User Agent
·Device Model
·Last date/sync time
Clicking More Info gives you much more information about a device, including:
·Device ID
·Device Manufacturer
·Device OS Version
·First date/time sync
and more.
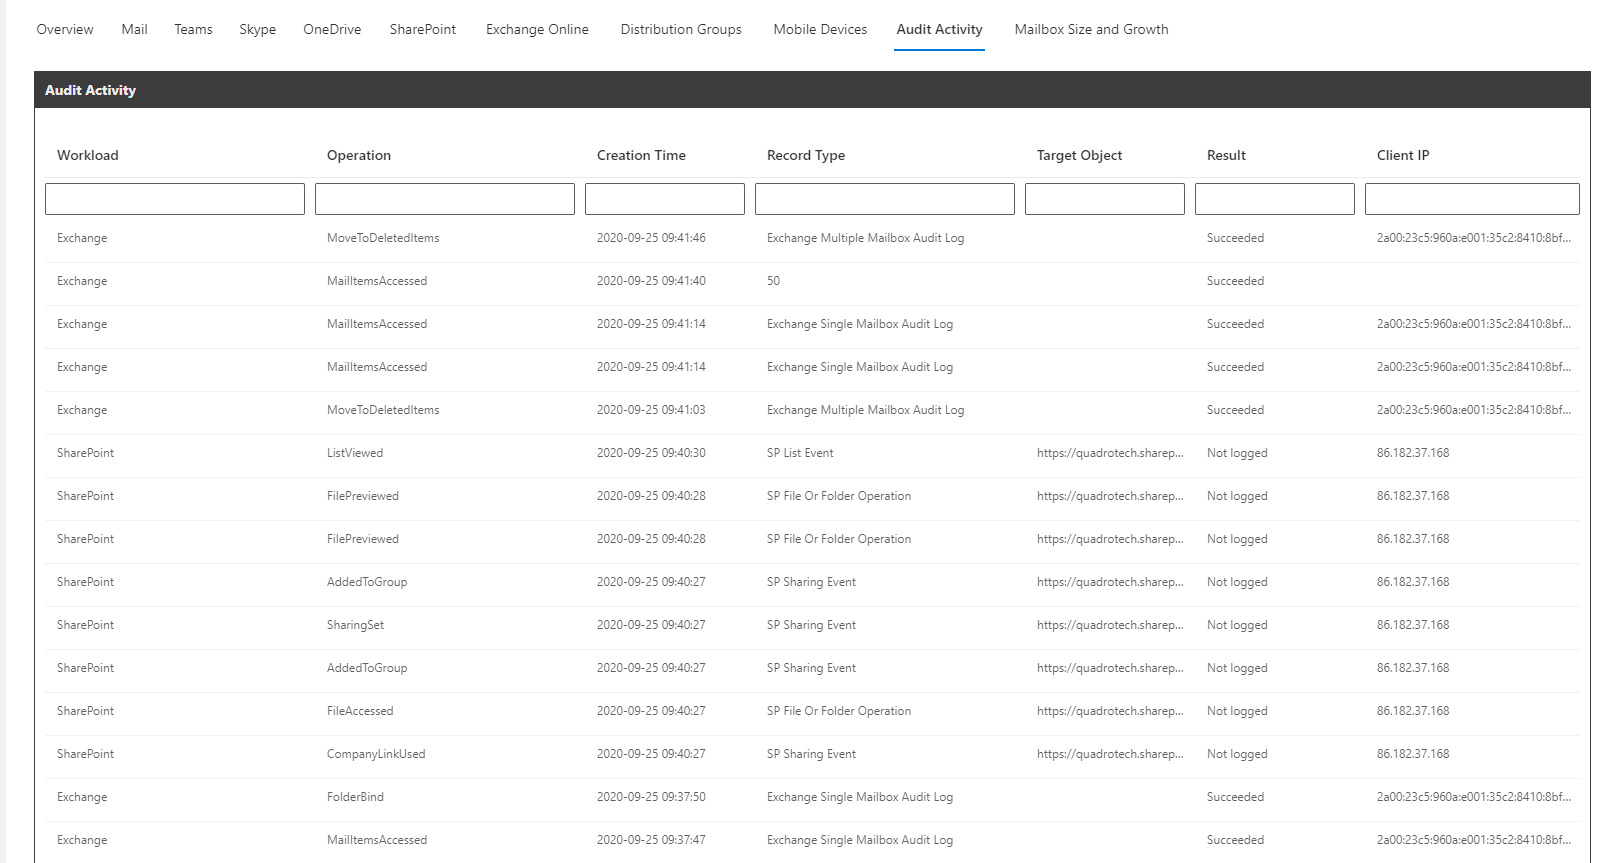
Audit Activity
The Audit Activity Tab gives you a detailed look at your users activity across all workloads, including:
·Operation
·Creation Time
·Record Type
·Target Object
·If the action was successful
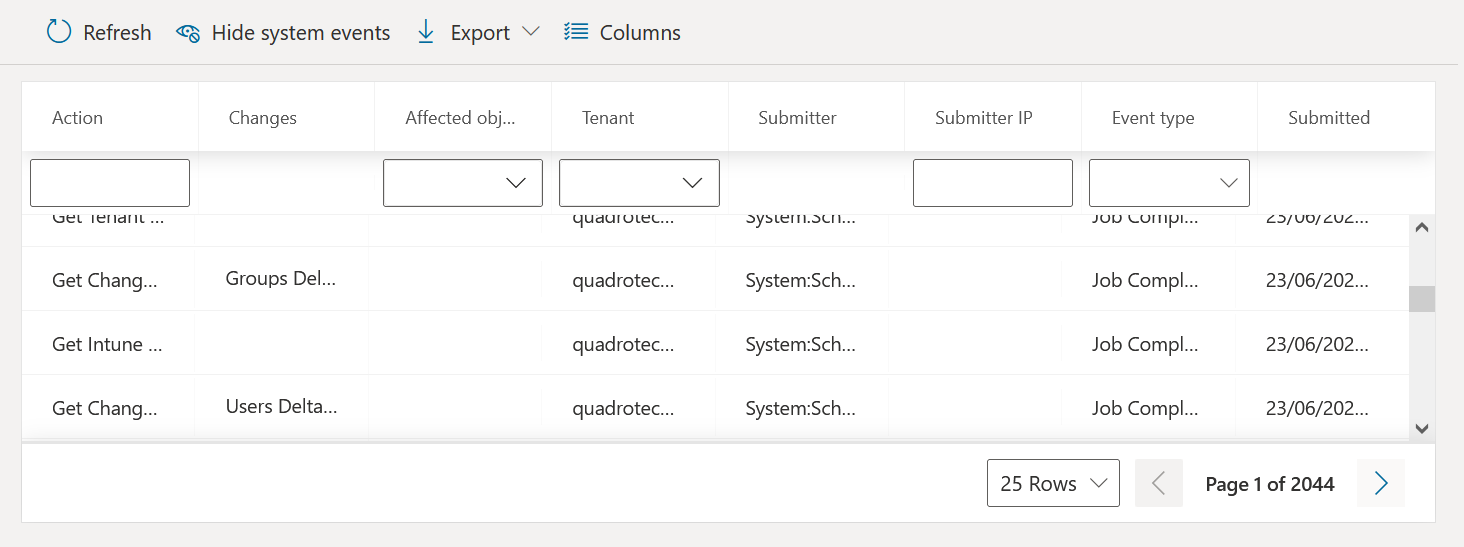
You will find an audit log under the Manage Administration service that shows who performed what actions against which object. Here is how it looks:
Actions you can complete on the Audit Log are:
·Refresh: Update the audit log to receive the most recent data.
·Hide/Show system events: this hides/shows system data, and will show/hide only data relating to Submitter IPs.
·Export: this exports data into a .csv file. Here, you can:
oExport all: this exports all data collected.
oExport page: this exports data in the page you are currently viewing. You can adjust the amount of rows in the table, then click Export page to export those amount of rows.
·Columns: You can add and remove columns from the table.
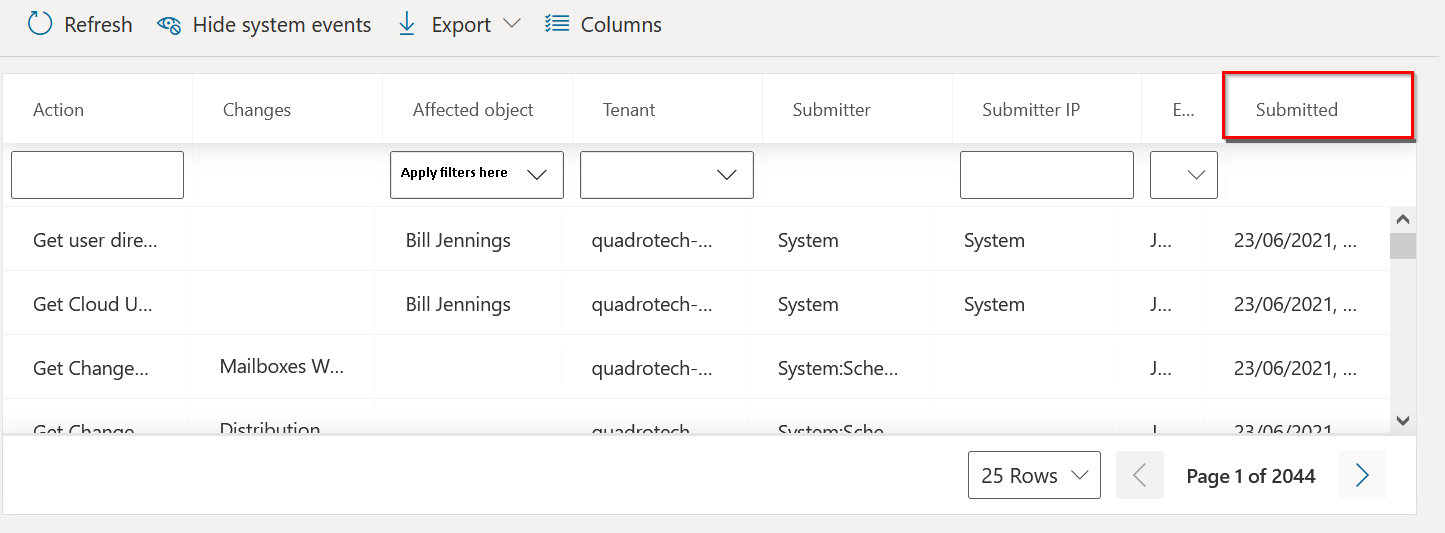
Filtering and sorting the audit log
Apply filters to the log using fields in the top row.
You can also sort the data by clicking on a column name. If the audit log is currently being sorted by a certain column, a line displays above the column name (shown below). Click the column name again to reverse the filter.
A Hide/Show System Events button displays above the audit log. Click this button to filter for only user-generated events.
Audit log contents
Here is a description of the contents of each column:
|
Field |
Description |
|---|---|
|
Action |
The action that was performed |
|
Changes |
Shows details of what was changed. For example, showing a phone number changed from 555-5555 to 444-4444. |
|
Affected object |
The resource the changes were performed against |
|
Tenant |
The tenant affected by the changes |
|
Submitter |
The user who initiated the event |
|
Submitter IP |
The IP address of the user who initiated the event |
|
Event type |
Shows whether the job is completed, errored, running, etc. |
|
Submitted |
Date and time the job was initiated |
Click here to watch a video on the audit log.
Virtual Business Boundaries (VBBs) gives system administrators more control over the data that the users within their tenant can see, modify and create reports from. VBBs are not static or confined; they support environments with many different logical overlaps and complexities, such as covering several geographic locations and/or departments. VBBs are designed to fit the intricate needs of the administrator, no matter the size of the environment, over the data in which is most relevant to them and their users.
This includes three concepts, which can be used individually or in combination:
1.Data Anonymization - Administrators have the ability to filter certain data and and data sources from its' users within the boundary, including data that the administrator can anonymize. For example, you can anonymize names, departments and emails from the user.
a.Use case: You want to set up Nova for a particular customer, and you want help desk staff to see data from a particular data source, but you do not want personal identifiable information (PII) to be revealed, such as names and email addresses. Putting these help desk staff into a VBB and anonymizing this data allows this to happen. You can then create another VBB for global administrators with no anonymization, so that these administrators can see the PII.
2.Data Source Restriction - Prevent users from viewing data from certain data sources and specific fields within those sources when viewing and creating reports.
a.Use case: You may have a large complex environment that has many different teams, for example a Teams administration team, a Microsoft Entra ID team and an email administration team, and you only want users to find these particular scopes of data. Here, you can assign a VBB to these individual users in these teams, and add the relevant data sources to these VBBs. Now the users in these VBBs can only see these particular data sources.
3.Data Scope Restriction - Filter the returned data, allowing users in a boundary to see a subset of the data based on a use case. For example, you can filter by country so those uses can only see data about users based in a specific country, or filter by department so users in the boundary only see information about users who are in a certain department.
a.Use case: You have an environment which spans many different countries and departments, but you wish to return reports that only specifies data from the United States for a team in that location. Adding users from the United States, and applying a United States data scope filter to a VBB allows those users to only see data from that location.
|
|
NOTES: ·For Virtual Business Boundaries to take effect in reports, an Microsoft Entra ID field must be included in the report. This field does NOT have to be the same field that is assigned to the boundary. ·Virtual Business Boundaries can only be created and accessed by a System Administrator. ·You can only input individual users when creating boundaries. Adding groups of users is not currently supported. |
VBBs give system administrators the ability to isolate data for their users. For example:
·Giving Level One support in Germany the ability to only see German users.
·Allowing a Business Unit manager to only see data for its users from within their Business Unit.
·Allowing business users to only see data for specific workloads (SharePoint Online, Teams, Exchange etc).
·Personal Identifiable Information can only be visible for those within certain geographies and/or departments, whilst being restricted to those outside of them.
To access Virtual Business Boundaries:
1.Log in to Nova with a user that has the System Administrator role.
2.Open the menu in the top left corner of the navigation menu, and select TMS Client.
3.Click Virtual Boundaries from the left navigation menu.