지금 지원 담당자와 채팅
지원 담당자와 채팅

NetVault 12.4 - Administration Guide

Introduction Getting started Configuring clients Managing catalog search Configuring storage devices
About storage devices SAN considerations Quest DR Series systems Quest QoreStor NetVault SmartDisk EMC Data Domain Systems Snapshot Array Manager Virtual Tape Libraries Virtual standalone drives Shared Virtual Tape Libraries Physical tape devices Storage tiers
Backing up data Managing policies Restoring data Managing NetVault Backup dashboard Managing jobs Monitoring logs Managing storage devices
Role-based access to manage storage devices Monitoring device activity Managing disk-based storage devices in list view Managing disk-based storage devices in tree view Managing the Snapshot Array Manager Managing tape libraries in list view Managing tape libraries in tree view Managing tape drives in list view Managing tape drives in tree view Adding shared devices
Managing storage media Managing user and group accounts Monitoring events and configuring notifications Reporting in NetVault Backup Working with client clusters Configuring default settings for NetVault Backup
About configuring default settings Configuring encryption settings Configuring plug-in options Configuring default settings for post-scripts Configuring default settings for Verify Plug-in Configuring Deployment Manager Settings Configuring Job Manager settings Configuring Logging Daemon settings Configuring Media Manager settings Configuring Network Manager settings Configuring Process Manager settings Configuring RAS device settings Configuring Schedule Manager settings Configuring Web Service settings Configuring Auditor Daemon settings Configuring firewall settings Configuring general settings Configuring security settings Synchronizing NetVault Time Configuring the reporting utility Configuring NetVault Backup WebUI default settings Configuring NetVault Backup to use a specific VSS provider Configuring default settings using Txtconfig
Diagnostic tracing Managing diagnostic data Using the deviceconfig utility NetVault Backup processes Environment variables Network ports used by NetVault Backup Troubleshooting
Common errors Safe Mode in NetVault Backup

Managing trace filters

NetVault Backup 11.2 or later allows you to manage trace filters to NetVault Backup processes (core and plug-in) from the NetVault Backup WebUI. You can change/ assign trace settings for these processes using the option Manage Trace Filters.

For the NetVault Backup Server: On the NetVault Server Settings page, under System and Security, click Diagnostic Tracing.
For the NetVault Backup Client: On the NetVault Server Settings page, click Clients. In the NetVault Backup Clients table, select the client, and click Next. Under System and Security, click Diagnostic Tracing.
3
In the Diagnostic Trace Settings page, click Manage Trace Filters.
5
In the Edit Trace Filter Mapping dialog box, configure the following settings:

Selected Process

Selected NetVault Backup process (core and plug-in) is displayed.

Filter

Click the down arrow and select any of the following filter options:

KillAll: When this filter is assigned to a process, the process will not generate any traces.
MessageOnly: If this filter is assigned to a process that process will only produce trace messages from MESSAGE module. All other trace messages will be filtered out.

Specify the following trace filter mapping options for the selected process:

Enable Filter: Select this option to enable the selected filter option for the selected process.
Force Disk Tracing: Select this option to allow the selected process to trace the disk (even when disk tracing is disabled).
Circular: Select this option to enable circular tracing and type or select the values in the following fields:
Lines per trace file: Number of lines per trace file when circular is enabled. When lines in a trace file exceed this threshold, traces are written to next trace file.
Number of trace files to keep: Number of trace files to keep when circular is enabled. When number of trace files exceed this threshold, oldest trace file will be overwritten.
6
Click Update to apply the new settings and close the dialog box.

Enabling tracing

Diagnostic tracing is disabled by default. When investigating a problem, Quest Technical Support might ask you to enable tracing on the relevant NetVault Backup machines to capture diagnostic information about the error condition. This information helps in determining the source of error condition. Once the traces are enabled for the server, warning is displayed as Diagnostics in the Header Pane of NetVault Backup.

fFor the NetVault Backup Server from Change Settings: On the NetVault Server Settings page, under System and Security, click Diagnostic Tracing. On the Diagnostic Trace Settings page, click Enable Tracing.
For the NetVault Backup Client from Change Settings: On the NetVault Server Settings page, click Clients. In the NetVault Backup Clients table, select the client, and click Next. Under System and Security, click Diagnostic Tracing. On the Diagnostic Trace Settings page, click Enable Tracing.
On the Manage Clients page, select the Trace Status check box or click Enable Tracing
On the Manage Clients page, select the client, and click Enable Tracing.
3
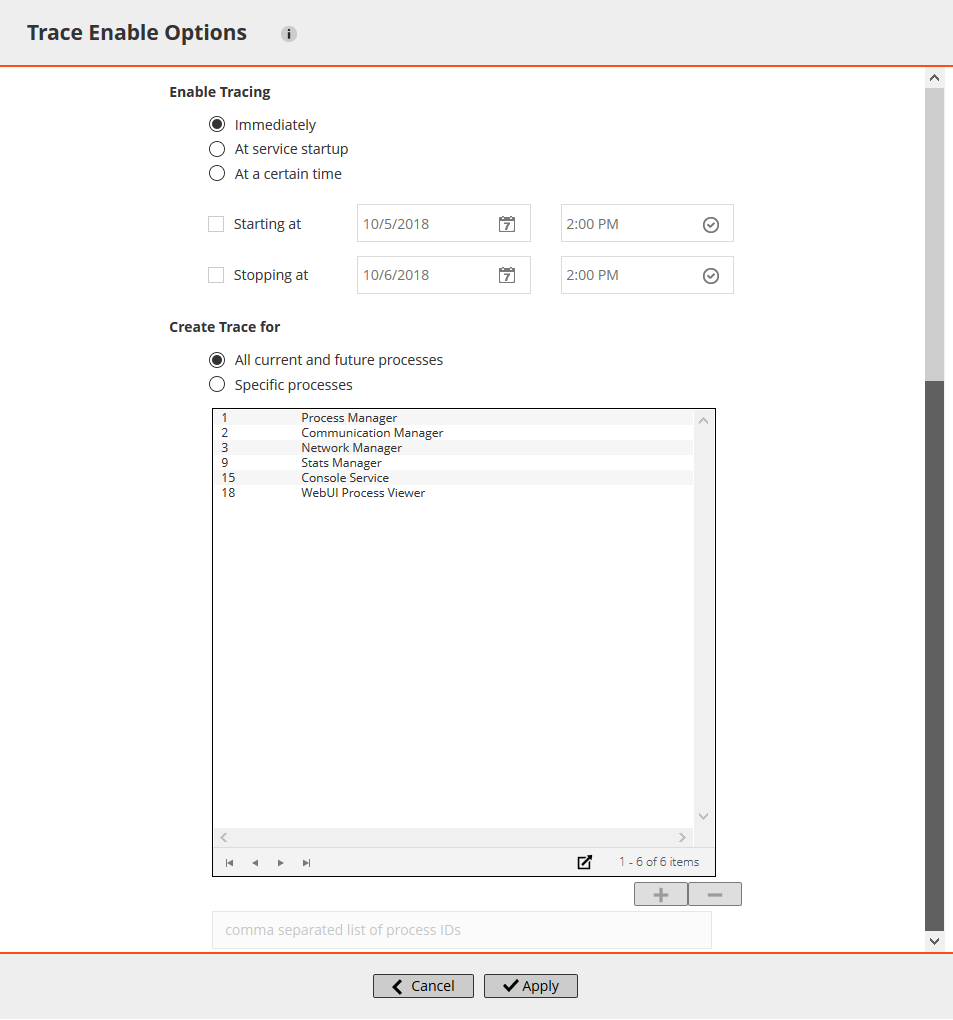
In the Trace Enable Options drawer, configure the following settings.
IMPORTANT: When you select multiple clients, the Trace Enable Options drawer does not show the list of process names. You can either use the All current and future processes option, or provide the process ID list in the associated box.

Enable Tracing

Select one of the following options:

Immediately: This option is selected by default. To start tracing immediately, use this option.
At service startup: To enable tracing at service startup, select this option.
NOTE: You can also enable tracing at service startup by clicking Trace Configuration on the Diagnostic Trace Settings page, and selecting the Enable trace on service startup check box in the Trace Configuration Options dialog box.
At a certain time: To automatically start and stop tracing at specified times, select this option, and specify the time window:
- Starting at: Select this check box, and type or select the date and time when tracing should be started on the machine.
- Stopping at: Select this check box, and type or select the date and time when tracing should be stopped on the machine.

Create Trace for

Specify the processes for which trace files are required:

All current and future processes: This option is selected by default. To generate trace files for all current and new processes, use this option.
Specific processes: To generate trace files for specific processes, select this option.
IMPORTANT: Trace settings do not persist across restarts of NetVault Backup Service unless you have selected the At service startup or Enable trace on service startup options. In such cases, tracing is enabled on all processes.
4
Click Apply to apply the settings and close the drawer.

Downloading trace files

Trace files are generated on the machines where the selected processes are running. You can use the WebUI to download trace files from various machines to the local machine where the WebUI is running.

From the NetVault Backup Server: On the NetVault Server Settings page, under System and Security, click Diagnostic Tracing.
From the NetVault Backup Client: On the NetVault Server Settings page, click Clients. In the NetVault Backup Clients table, select the client, and click Next. Under System and Security, click Diagnostic Tracing.
4
Click Download, and in the confirmation dialog box, click OK.

Changing the trace directory location

By default, the trace container directory is created under the NetVault Backup installation directory. You can modify the default settings to specify a new location for the container directory. When tracing is enabled, a session directory is created under the container directory; all trace files generated during the session reside in this directory.

For the NetVault Backup Server: On the NetVault Server Settings page, under System and Security, click Diagnostic Tracing.
For the NetVault Backup Client: On the NetVault Server Settings page, click Clients. In the NetVault Backup Clients table, select the client, and click Next. Under System and Security, click Diagnostic Tracing.
3
On the Diagnostic Trace Settings page, click Trace Configuration. In the Trace Configuration Options dialog box, configure the following setting:
Trace Container Directory: Specify the new location for the trace container directory. You must provide the full filepath.
4
Click Apply to apply the new settings and close the dialog box.
관련 문서

The document was helpful.

평가 결과 선택

I easily found the information I needed.

평가 결과 선택