지금 지원 담당자와 채팅
지원 담당자와 채팅

NetVault 12.4 - Administration Guide for Managed Service Providers

Introduction Getting started Configuring clients Managing catalog search Configuring storage devices
About storage devices SAN considerations Quest DR Series systems Quest QoreStor NetVault SmartDisk EMC Data Domain Systems Snapshot Array Manager Virtual Tape Libraries Virtual standalone drives Shared Virtual Tape Libraries Physical tape devices Storage tiers
Backing up data Managing policies Restoring data Managing NetVault Backup dashboard Managing jobs Monitoring logs Managing storage devices
Role-based access to manage storage devices Monitoring device activity Managing disk-based storage devices in list view Managing disk-based storage devices in tree view Managing the Snapshot Array Manager Managing tape libraries in list view Managing tape libraries in tree view Managing tape drives in list view Managing tape drives in tree view Adding shared devices
Managing storage media Managing user and group accounts Managing Tenant Monitoring events and configuring notifications Reporting in NetVault Backup Working with client clusters Configuring default settings for NetVault Backup
About configuring default settings Configuring encryption settings Configuring plug-in options Configuring default settings for post-scripts Configuring default settings for Verify Plug-in Configuring Deployment Manager Settings Configuring Job Manager settings Configuring Logging Daemon settings Configuring Media Manager settings Configuring Network Manager settings Configuring Process Manager settings Configuring RAS device settings Configuring Schedule Manager settings Configuring Web Service settings Configuring Auditor Daemon settings Configuring firewall settings Configuring general settings Configuring security settings Synchronizing NetVault Time Configuring the reporting utility Configuring NetVault Backup WebUI default settings Configuring NetVault Backup to use a specific VSS provider Configuring default settings using Txtconfig
Diagnostic tracing Managing diagnostic data Using the deviceconfig utility NetVault Backup processes Environment variables Network ports used by NetVault Backup Troubleshooting
Common errors Safe Mode in NetVault Backup

Viewing log messages

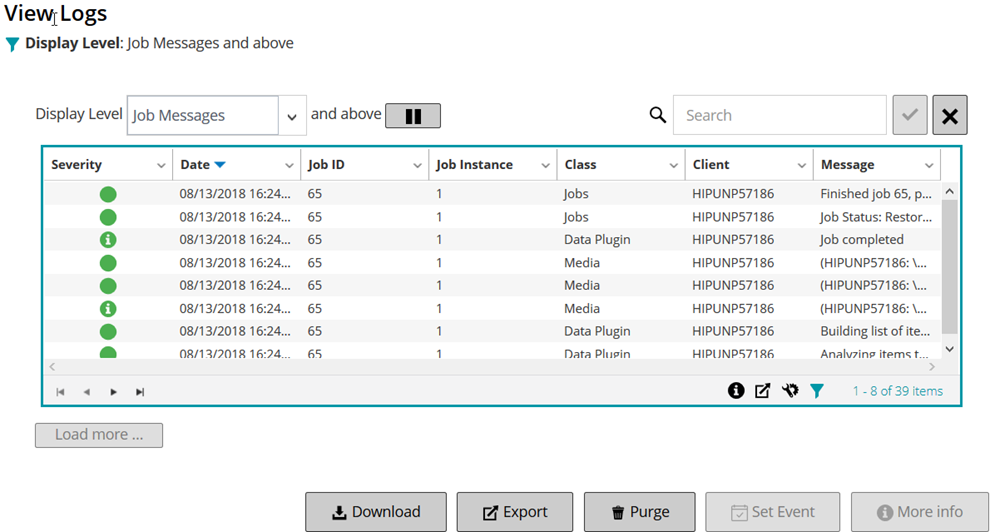
You can view the log messages from the View Logs page. From this page, you can perform various log-related tasks, like download or export log messages, set log events, or purge log messages.

MSP administrator, tenant administrator, and tenant user can view job messages of the authorized client machines.

2
On the View Logs page, you can view the log messages generated by various processes.
Figure 26. View Logs page

Severity: Severity level of the message.
Date: Sate and time when the log was generated.
Job ID: Job identification number.
Class: Type of operation that generated the logs.
Client: Name of the client for which the log was generated.
Message: Detailed log message or description.

Background

General log messages.

Information

Log messages related to media, scheduler, and system activities.

Job message

Log messages related to backup, restore, and report jobs.

Warning

Problems that might not have caused a job to fail.

Error

Problems that might have caused a job to fail.

Severe error

Critical problems that might have caused an operation to fail.

To view the context information, click anywhere in the Severity column. Alternatively, select the message, and click More Info. The dialog box that appears can include data transfer details, execution scripts, or other information. After reviewing the details, click OK to close the dialog box.


Setting the 'Display Level' to a particular severity level shows log messages for the selected severity and higher.

To set the filter options (For more information on table filter options for View Logs page, see Table 8), view the page size setting, column sort order, applied filters in the table, export the records, or edit table settings, click the icons at the lower- right corner of the table.
5
You can use the Display Level option to filter the messages based on their severity level. When you specify the severity level, the messages at that level and higher are displayed on the View Logs page.
By default, Display Level is set to Job Messages. With this setting, you can view Job Messages, Warnings, Errors, and Severe errors on the page. To specify the minimum severity level for messages that are displayed, select the level in the Display Level list.
6
The View Logs page loads a maximum of 10,000 records initially. The total number of records fetched is displayed at the lower-right corner of the table.
You can click Load more to load the next set of records, if available. Each load action fetches a maximum of 10,000 records. This button is disabled if there are no more records to load.

Downloading logs

When investigating a reported problem, Quest Technical Support might request you to provide the log dump from the NetVault Backup Server. You can generate the dump file by using the Download or Export method available on the View Logs page.

The Download method creates dump files on the local machine where the WebUI is running. This method is useful if you are accessing the server from a remote machine. The Export method creates the file on the NetVault Backup Server. For more information about this method, see Exporting logs.

The supported dump formats are text, binary, and database table dump. By default, the dump file includes all current logs. You can use the filter options to download log entries that meet the specified criteria. For instance, you can set filter options to display log entries for a specific period or a specific job ID number, and then download these entries to a dump file.

2
Click Download, and in the Confirm Download Logs dialog box, select the dump format:
Binary Log: Select this option to export the logs to a binary file (“.nlg”).
Text Log: Select this option to export the logs to a text file.
Database Table Dump: Select this option to export the logs to a PostgreSQL dump (pg_dump) file.
3
Click Download, and in the confirmation dialog box, click OK.

Exporting logs

When investigating a reported problem, Quest Technical Support might request you to provide the log dump from the NetVault Backup Server. You can generate the dump file by using the Download or Export method available on the View Logs page.

The Download method creates dump files on the local machine where the WebUI is running. This method is useful if you are accessing the server from a remote machine. For more information about this method, see Downloading logs. The Export method creates the file on the NetVault Backup Server.

The supported dump formats are text, binary, and database table dump. By default, the dump file includes all current logs. You can use the filter options to export log entries that meet the specified criteria. For instance, you can set filter options to display log entries for a specific period or a specific job ID number, and then export these entries to a dump file.

2
On the View Logs page, click Export.
3
In the Export Logs dialog box, configure the following options.
Table 77. Export logs

File Name

Type a filename for the log file.

You can also select an existing file from the dump file list. If you select or specify an existing file, NetVault Backup overwrites the file.

Depending on the dump format selected, the dump files are created in the binary, text, or pgdump directories under <NetVault Backup home>\logs\dumps (on Windows) or <NetVault Backup home>/logs/dumps (on Linux).

To create the dump file in a different location, specify the full path.

Binary Log

Select this option to export the logs to a binary file (.nlg).

Text Log

Select this option to export the logs to a text file (.txt).

Database Table Dump

Select this option to export the logs to a PostgreSQL dump (pg_dump) file (.dmp).

4
Click Export to export the logs.

Manually purging the log messages

Log messages that are older than 30 days are automatically purged from the database. You can also manually delete the log messages by using the Purge Logs method available on the View Logs page.

2
On the View Logs page, click Purge.
3
In the Purge Logs dialog box, configure the following option:
Delete log entries before: Type or select the date and time to delete all log messages created before the specified time.
4
Click Purge.
관련 문서

The document was helpful.

평가 결과 선택

I easily found the information I needed.

평가 결과 선택