지금 지원 담당자와 채팅
지원 담당자와 채팅

Foglight 6.0.0 - Performance Tuning Field Guide

Overview Hardware and Operating System Tuning Management Server Tuning Java Virtual Machine Tuning Backend Database Tuning High Availability (HA) Tuning Agent Tuning Store and Forward Processing Appendix: Performance Health Check Appendix: Analyzing a Support Bundle

JVM Memory Usage

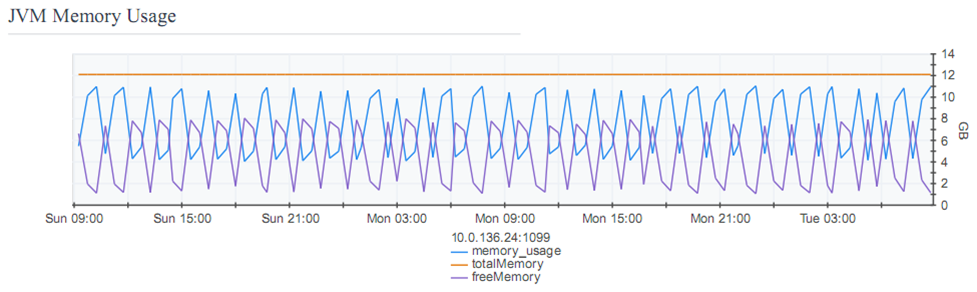
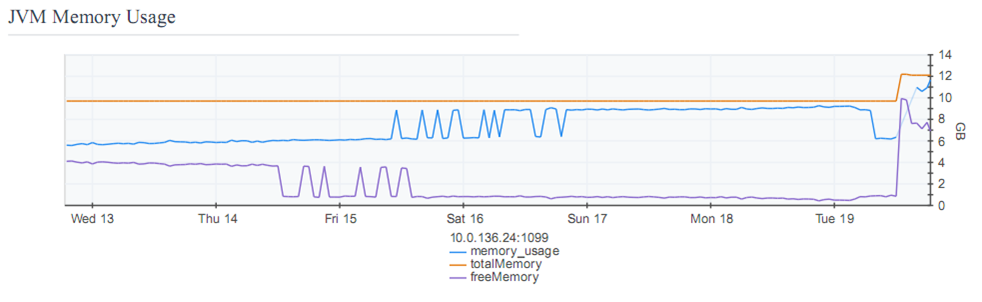
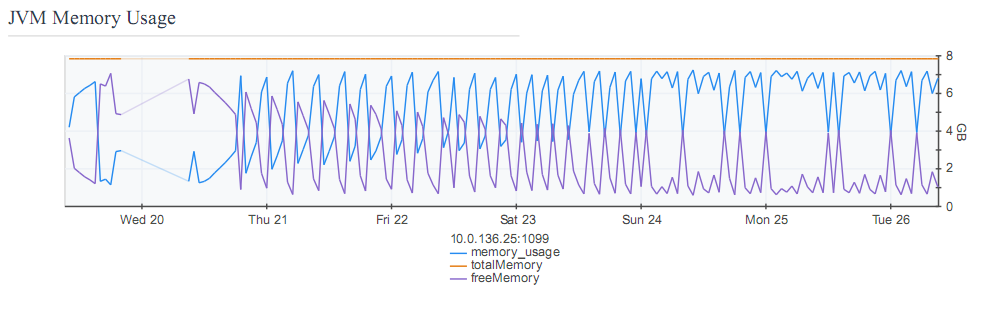
The Support Bundle contains a Foglight® Management Server Performance Report (PerfReport.pdf). In the Performance Report, under the “Management Server Java Virtual Machine Memory” heading, there are a number of JVM memory charts.

In the JVM memory charts, the JVM heap is divided into New Generation, Old Generation, and Permanent Generation. The New Generation JVM heap is further divided into Eden and Survivor spaces. The charts display the memory utilization for each of these. The charts can help you determine whether or not the entire heap (Xms and Xmx), or just one generation (NewSize and MaxNewSize), is insufficient.

Typically, when objects are first created, they reside in the Eden space. Once objects survive a garbage collection (GC), they are moved into the Survivor space. If the garbage collector determines that the objects in the Survivor space are no longer live objects, then they are moved into the Old Generation. This helps the JVM efficiently manage its memory, because short-lived objects can easily be collected from the Eden space without the need for the garbage collector to scan the entire heap.

Typically, a sawtooth (up, down, up, down) pattern is a normal memory usage pattern for the Management Server. The server generates some garbage in the Old Generation, which is fine. Then, at some point, the JVM recycles the garbage.

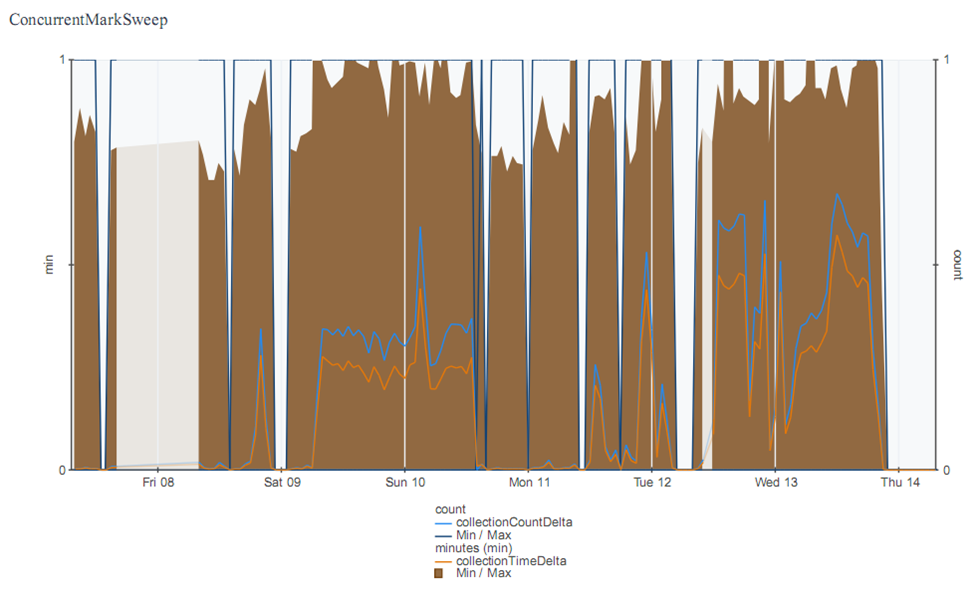
A sudden drop in the Old Generation memory usage does not always indicate that a full GC has occurred, because the server now uses the parallel GC which runs in the background. Full GCs (during which the server slows down due to the garbage collection) are usually visible in the GC chart for ConcurrentMarkSweep, which is included in PerfReport.pdf. If the time or count lines rise above zero for a prolonged period, that indicates that the server is probably running out of memory. The GC becomes intense only when the sawtooth pattern hits 100%.

Permanent Generation is used for items like classes that are typically never collected.

If the Min/Max/Used line on the CMS Old Gen chart repeatedly hits the horizontal purple (Committed) line, further diagnosis (for example, matching with other performance metrics at the time) is required. That pattern typically indicates that the JVM was working extra hard to reclaim memory. Check for this situation by opening the Diagnostic Snapshot and searching for “Cache Policies”. This shows the entries that are in the cache and therefore consuming memory. If there is no list of entries, then there were no entries when the snapshot was taken.

To find the actual retention policy, open the Monitoring Policies XML file and search for lifecycle definitions.

Good:

A consistent and regular pattern of memory being used and freed. Garbage collections are performing correctly.

Bad:

A gradual exhaustion of the heap is indicated by slow and steady decline in the free memory, leading to a flat line. Here, no memory is being freed by GC.

Good, becoming Bad:

Part of the graph indicates a constant, regular pattern of memory being freed. The warning sign is that less memory is being freed each time in the later cycles.

Management Server Garbage Collectors

There are two types of garbage collectors:

1
ParNew—short and easy collections done in parallel, these have a low impact on the Foglight® Management Server in normal operation.
2
ConcurrentMarkSweep—long and time-consuming collections that cause the JVM to pause everything else. The Management Server can appear to “freeze” during these cycles.

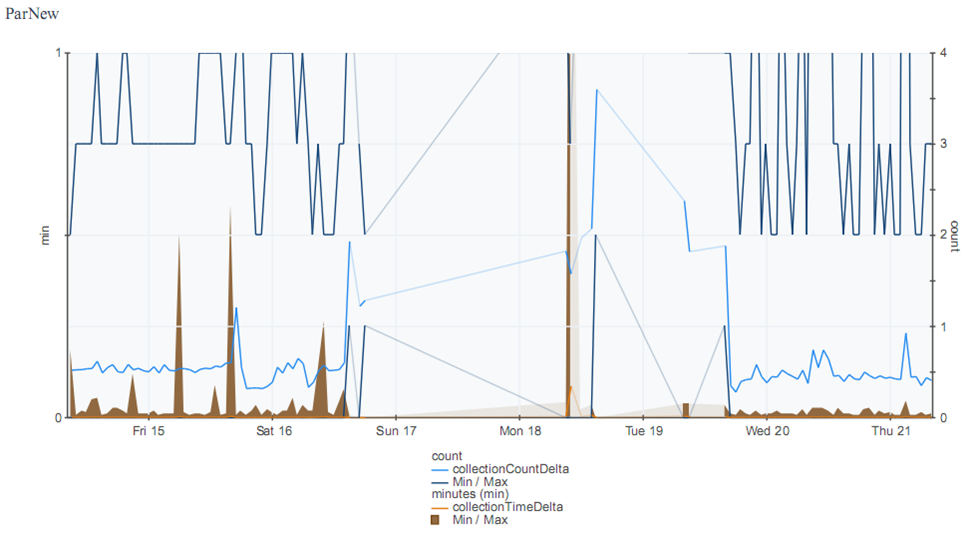
Examine the graphs for indications of issues.

The graph above indicates problems with the ParNew GC. The count (blue line) is up to 4, and the time (orange and brown) has increased to minutes.

The graph above indicates problems with the ConcurrentMarkSweep GC. The time (brown) has increased to minutes and the GC is called frequently.

These two graphs indicate the following issues:

Increasing the heap size will likely seem to resolve an issue, but the root cause of the memory issue will soon grow to the new heap level, causing the issue to reappear.

Proper analysis of heap usage is necessary to ensure the root cause is resolved.

JDBC Connection Pool

The connection pool by itself does not indicate a problem, but can point to possible causes, such as: slow database, inefficient queries, or data intensive dashboards.

If the available connections (orange line) flatlines at the bottom, the database connections are used for long periods of time, so no database connections can be made. The following error indicates no available connections:

blocking timeout ( 30000 [ms] ); - nested throwable:(javax.resource.ResourceException: No ManagedConnections available within configured blocking timeout ( 30000 [ms] ))

Keep this in mind while investigating other issues.

Derivation Rulette

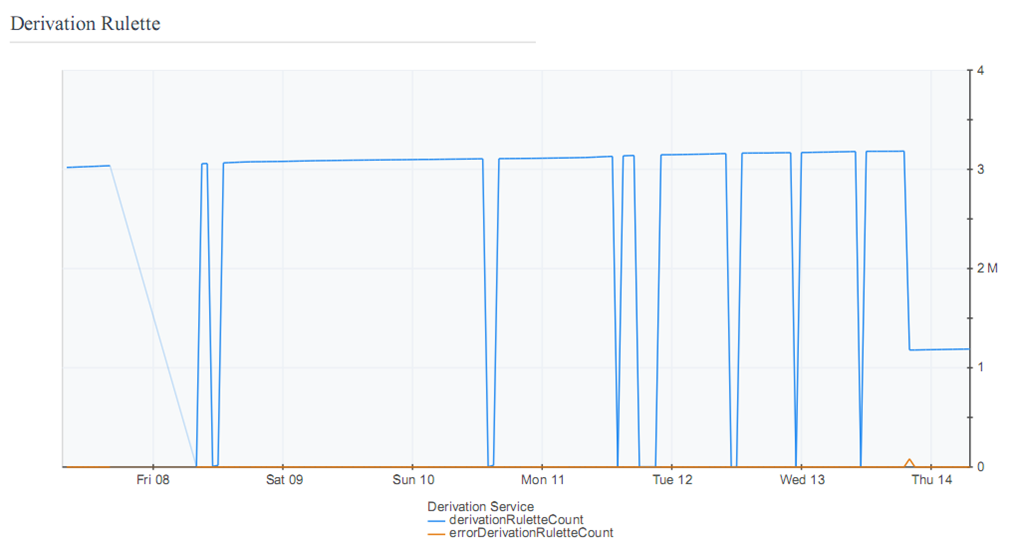
A derivation rulette is an instance of a derived metric definition that is tied to a particular Topology Object. Derivation rulettes take memory to store. Depending on the Foglight® Management Server version, anywhere from 4k (Management Server versions earlier than 5.5.5) to 1.5k (versions 5.5.5 and later). The more derivation rulettes you have, the more JVM heap is locked and cannot be freed, which leads to JVM heap exhaustion and performance problems.

Examine the count to determine whether there is an issue.

Examine the diagnostic snapshot to determine the source of the problematic rulettes.

관련 문서

The document was helpful.

평가 결과 선택

I easily found the information I needed.

평가 결과 선택