FAQts view
The FAQts view is provided in the VMware Explorer dashboard and is available in the VMware Explorer Primary view through a navigation tab.
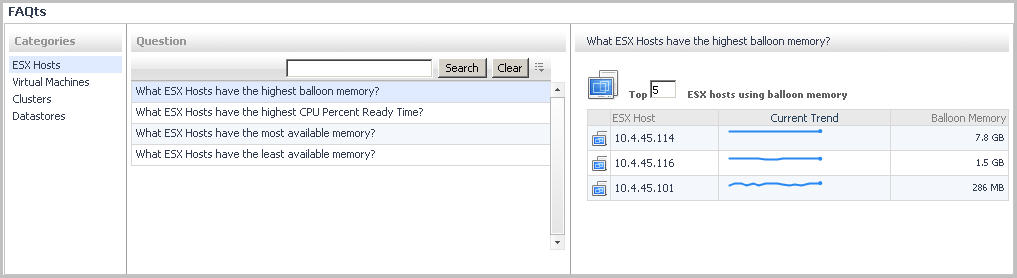
Through three embedded views (the Categories, Question, and Answer views), the FAQts view enables you to ask questions and provides the answers to those questions.
The FAQts view is made up of the following embedded views:
This view provides an answer to the question selected in the Questions view. The answer appears in the following form:
Top x <objects of category>…
where x is the number of objects of the category you provided in the Categories view.
Specify x by entering a number. The answer is relative to the subset of the infrastructure you are viewing in the dashboard. For example, the top 5 datastores are different for each individual cluster in the infrastructure.
This view lists the categories for which questions can be answered for you by Foglight for Hyper-V.
Click a category in the list to select it.
This view lists the questions, for the category selected in the Categories, that can be answered for you by Foglight for Hyper-V.
Click a question in the list to select it.
If the list of questions is long and you want to narrow it down, search for a particular text string using the Search Questions box.
Memory tab
This tab is available in the VMware Explorer. To find it, open the VMware Explorer and on the Virtual Infrastructure view, that appears on the navigation panel, select an ESX® host instance. In the VMware Explorer, open the Memory tab.
The VMware Explorer’s Memory tab displays the combined memory utilization for an ESX host, showing the amount memory used by each virtual machine that is running on that host. This includes the amount of active and shared memory in GB, all during a selected time period.
This view is made up of the following embedded views:
This view shows the amounts of active memory used by each virtual machine that is running on the ESX host during the selected time period.
This view shows the amounts of shared memory used by each virtual machine that is running on the ESX host during the selected time period.
This view shows a list of all virtual machines that are running on the selected ESX host. For each virtual machine, it shows its name along with a color indicator for displaying this information in the Active Memory and Shared Memory views. This allows you to show or hide the related resource use from these views.
The list also shows the following information for each virtual machine:
|
• |
Active. Amount of physical memory that is actively being used. |
|
• |
Balloon. Amount of memory being used by the VMware® Memory Control Driver to allow the virtual machine OS to selectively swap memory. |
|
• |
Consumed. Amount of memory that is consumed by current processes. |
|
• |
Granted. Total amount of memory that is allocated to the virtual machine. |
|
• |
Shared. Amount of memory that is freed up on the host due to transparent page sharing. |
|
• |
Swapped. Amount of memory that is stored in disk swap space. |
Monitor tab
This tab is available in the VMware Explorer. To find it, open the VMware Explorer and on the Virtual Infrastructure view, that appears on the navigation panel, select the server or virtual machine instance. In the VMware Explorer, open the Monitor tab.
The VMware Explorer’s Monitor tab shows details of system resources consumption for a server or a virtual machine.
This view is made up of the following embedded views:
This view shows the numbers of ESX® hosts and virtual machines the selected ESX host or virtual machine belongs to. It also shows the cluster’s combined current CPU and memory utilization along with the disk and network I/O rates, and any alarm counts associated with the cluster, broken by the alarm state.
This view shows the number of ESX hosts and virtual machines in the datacenter the selected virtual machine is associated with. It also shows the datacenter’s combined current CPU and memory utilization along with the disk and network I/O rates, and any alarm counts associated with the datacenter, broken by the alarm state.
This view shows the utilization of the selected server’s resources. It shows the current CPU utilization for each CPU, and the composite CPU utilization across all CPUs on the selected ESX host. This view also provides insights into memory usage, and disk and network IO rates.
This view shows the numbers of virtual machines in the resource pool the selected virtual machine is associated with. It also shows the resource pool’s combined current CPU and memory utilization along with the disk and network I/O rates, and any alarm counts associated with the resource pool, broken by the alarm state.
This view shows the numbers of virtual machines that are running in the ESX Host to which the selected virtual machine belongs. It also shows the ESX Host’s combined current CPU and memory utilization along with the disk and network I/O rates, and any alarm counts associated with the virtual machines, broken by the alarm state.
This view shows the utilization of the resources allocated to the selected virtual machine. It shows the current CPU utilization for each allocated CPU, and the composite CPU utilization across all CPUs on the selected ESX host. This view also provides insights into memory usage, and disk and network IO rates.
This view shows a list of virtual machines associated with the selected ESX host. For each virtual machine, the list shows its name, followed by the total counts of alarms associated with that VM, broken down by alarm types (normal, warning, critical, fatal). This view also indicates how many virtual machines are currently running.
This view shows a list of messages associated with the selected virtual machine.
Performance tab
This tab is available in the VMware Explorer. To find it, open the VMware Explorer and on the Virtual Infrastructure view, that appears on the navigation panel, select a Virtual Center, datacenter, cluster, ESX® host, resource pool, or one of the following containers: Datacenters, ESX Hosts, Resource Pools, or Virtual Machines. In the VMware Explorer, open the Performance tab.
This tab displays the resource utilization for the selected object or group of objects over a selected period of time.

This tab is made up of the following embedded views:
This view shows the CPU utilization summary for the selected component based on its total capacity, including the percentage of available CPU processing that is currently used, and the percentage of time the CPU is ready but is not used due to other reasons, during a selected time period.
This view shows the disk utilization summary for the selected component, including the disk throughput rate, and the rates of data that is read from or written to the disk, during a selected time period.
This view shows a list of all ESX hosts associated with the selected component. For each host, it shows its name, the number of CPUs, the current percentages of CPU and memory use, disk throughput rate, rate at which disk commands are issued, and the rate at which data packets are sent to and received from the network.
This view shows the physical memory utilization summary for the selected component, broken into the amounts of memory that is swapped to disk, actively used, and allocated, all during a selected time period.
This view shows the network utilization summary for the selected component, including the average rate of network throughput, and the amounts of data sent to and received from the network.
