지금 지원 담당자와 채팅
지원 담당자와 채팅

Foglight for vCloud Director 5.7.4.1 - User and Reference Guide

Getting Started Setting Up Monitoring Agents Investigating Resource Consumption Levels Investigating Object Dependencies Reference

Exploring the Use of Virtual Center, Resource Pool, or ESX Host Resources

The following views display the amounts of system resource consumption for a selected virtual center, resource pool, or ESX® host:

These views can help you to identify and prevent potential bottlenecks by reallocating resources where they are most needed. They appear on the right in the Quick View when you select a virtual center, resource pool, or ESX host in the left pane.

Figure 25. Summary - Virtual Center view

The information appearing on this view is displayed in the Resource Utilizations view.

For information about the Related Items and All Alarms views also appearing in this summary, see the following :

Resource Utilizations view

Use this view to review the levels of CPU, network, memory, and disk utilization and overall consumption, broken down into four simple views. Foglight for vCloud Director populates these values using the metrics collected by Foglight for VMware. For more information about the metrics appearing in these views, see the Foglight for VMware User and Reference Guide.

The current percentage of the selected object’s CPU load, used to execute system code and user programs, based on the total CPU capacity.

The percentage of the selected object’s CPU resources spent on executing system code and user programs during the selected time period.

The percentage of the selected object’s CPU resources that is ready to execute system code and user programs during the selected time period.

The current rate at which the selected object transfers data from and to the network.

The rate at which the selected object sends data to the network during the selected time period.

The rate at which the selected object receives data from the network during the selected time period.

The amount of memory that is stored in disk swap space.

The amount of the selected object’s memory that is freed up due to transparent page sharing.

The amount of physical memory that is actively being used by the VMware Memory Control Driver to allow the guest OS to selectively swap memory.

The amount of the available memory that the selected object uses during the selected time period.

The total amount of memory available to the selected object.

The percentage of memory the selected object currently uses.

The current disk I/O rate for the selected object.

The rate at which the selected object reads data from the disk during the selected time period.

The rate at which the selected object writes data to the disk during the selected time period.

Exploring the Use of Datastore or Datastore Cluster Resources

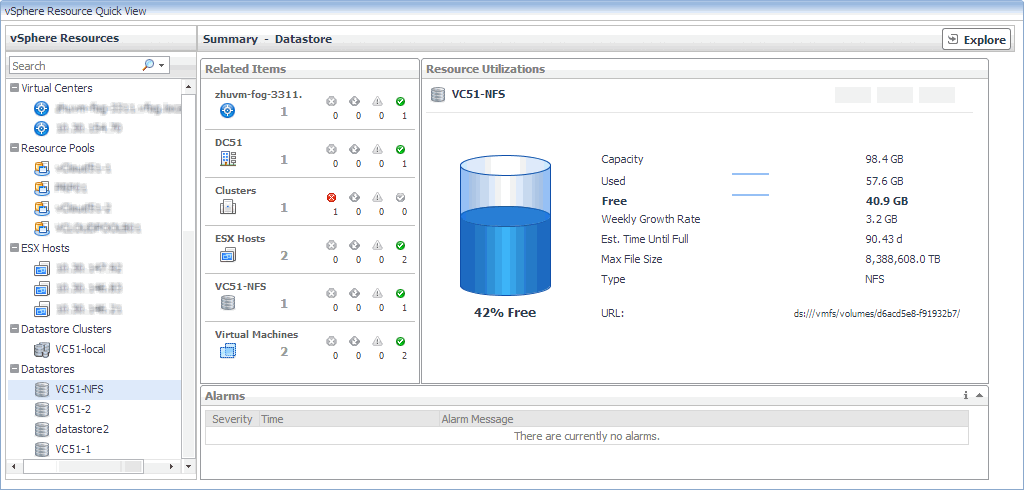
The Summary - Datastore and Summary - Datastore Cluster views display the levels of storage capacity and growth for a datastore or datastore cluster. These views helps you predict the amount of time after which the selected object’s storage resources will be full and no longer available. It can help you identify and prevent potential bottlenecks by reallocating storage space where it is most needed.

This summary view appears on the right side of the Quick View when you select a datastore or a datastore cluster.

The information appearing on this view is displayed in the Resource Utilizations view.

For information about the Related Items and All Alarms views also appearing in this summary, see the following :

Resource Utilizations view

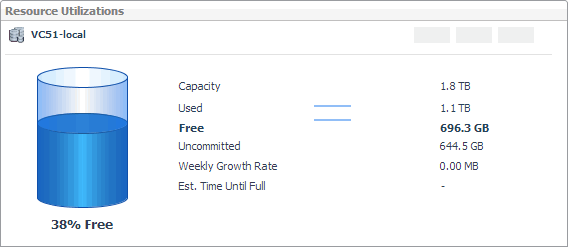
Use this view to review the levels of disk utilization for a datastore or a datastore cluster. The combination of items in this view depends on the type of the selected object. For example, both datastore and datastore cluster display the total disk capacity, amounts of used and free disk space, percentage od free space, estimated weekly rate, and estimated time after which the disk will be full. For each datastore, this view also shows the maximum file size and file system type, while for datastore clusters this view also contains the amount of uncommitted storage space.

관련 문서

The document was helpful.

평가 결과 선택

I easily found the information I needed.

평가 결과 선택