Table 24. General Info view
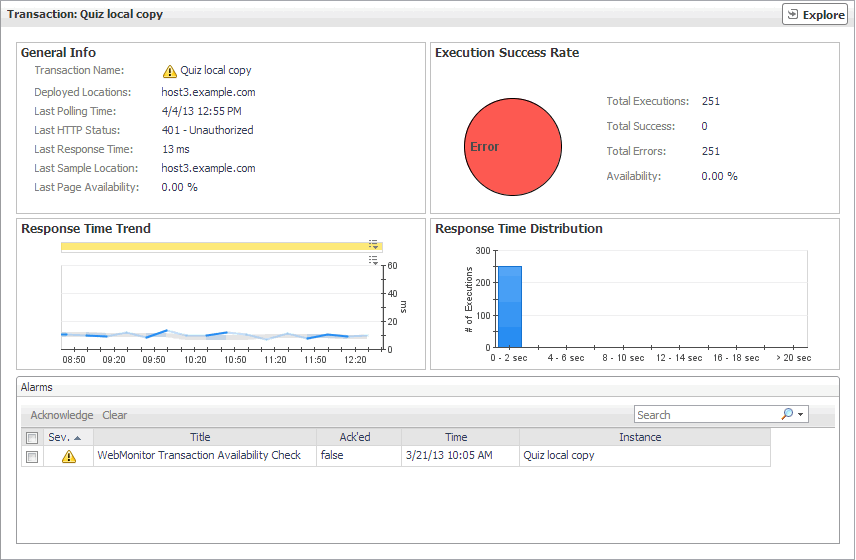
The Transaction view displays overall response and availability information for the selected transaction. Use it to get a better idea of how well this Web site is performing and to investigate potential bottlenecks.
 o
o
The Transaction view appears on the right.
This view is made up of the following embedded views:
|
|
Shows general details about the most recent collection attempt. |
|
|
|
• |
Deployed Locations. The names of the hosts running the instances of the Web Monitor Agent configured to monitor this Web site. |
|
• |
Last HTTP Status. The most recent HTTP status code, indicating the result of the most recent transaction with the monitored Web site. |
|
• |
Last Page Availability. The percentage of time the Web site was available when the Web Monitor Agent attempted to collect information from it during the most recent data collection attempt. |
|
• |
Last Response Time. The amount of time the Web Monitor Agent waited for a response from the monitored Web site during the most recent data collection attempt. |
|
• |
Last Sample Location. The name of the host running the Web Monitor Agent instance that performed the most recent data collection from this Web site. |
|
|
|
Indicates the general success rate the monitoring agents encountered during data collection. |
|
|
|
• |
Availability. The percentage of time the Web site was available when the Web Monitor Agent instances configured to monitor this Web site attempted to collect information. |
|
• |
Total Errors. The total number of execution attempts that resulted in errors all instances of the Web Monitor Agent configured to monitor this Web site encountered during the selected time range. |
|
• |
Total Executions. The total number of execution attempts all instances of the Web Monitor Agent configured to monitor this Web site performed during the selected time range. |
|
• |
Total Successes. The total number of successful execution attempts all instances of the Web Monitor Agent configured to monitor this Web site encountered during the selected time range. | |
|
|
Indicates the time the Web site takes for responding to monitoring requests and its health. |
|
|
|
• |
Health History. A color-coded bar, representing the alarm state of the monitored location over the selected time range. The color of the bar changes depending on the alarm state. Red indicates a Fatal state, orange indicates Critical, yellow means Warning, and green is the Normal State. |
|
• |
Response Time. The amount of time the Web site takes to respond to monitoring requests, over the selected time range. High values in the graph can indicate potential bottlenecks that likely need to be investigated. The grey-shaded area indicates baseline values for this metric, representing the expected value range during the selected time period. | |
Table 25. Execution Success Rate view
The Transaction view displays overall response and availability information for the selected transaction. Use it to get a better idea of how well this Web site is performing and to investigate potential bottlenecks.
 o
o
The Transaction view appears on the right.
This view is made up of the following embedded views:
|
|
Shows general details about the most recent collection attempt. |
|
|
|
• |
Deployed Locations. The names of the hosts running the instances of the Web Monitor Agent configured to monitor this Web site. |
|
• |
Last HTTP Status. The most recent HTTP status code, indicating the result of the most recent transaction with the monitored Web site. |
|
• |
Last Page Availability. The percentage of time the Web site was available when the Web Monitor Agent attempted to collect information from it during the most recent data collection attempt. |
|
• |
Last Response Time. The amount of time the Web Monitor Agent waited for a response from the monitored Web site during the most recent data collection attempt. |
|
• |
Last Sample Location. The name of the host running the Web Monitor Agent instance that performed the most recent data collection from this Web site. |
|
|
|
Indicates the general success rate the monitoring agents encountered during data collection. |
|
|
|
• |
Availability. The percentage of time the Web site was available when the Web Monitor Agent instances configured to monitor this Web site attempted to collect information. |
|
• |
Total Errors. The total number of execution attempts that resulted in errors all instances of the Web Monitor Agent configured to monitor this Web site encountered during the selected time range. |
|
• |
Total Executions. The total number of execution attempts all instances of the Web Monitor Agent configured to monitor this Web site performed during the selected time range. |
|
• |
Total Successes. The total number of successful execution attempts all instances of the Web Monitor Agent configured to monitor this Web site encountered during the selected time range. | |
|
|
Indicates the time the Web site takes for responding to monitoring requests and its health. |
|
|
|
• |
Health History. A color-coded bar, representing the alarm state of the monitored location over the selected time range. The color of the bar changes depending on the alarm state. Red indicates a Fatal state, orange indicates Critical, yellow means Warning, and green is the Normal State. |
|
• |
Response Time. The amount of time the Web site takes to respond to monitoring requests, over the selected time range. High values in the graph can indicate potential bottlenecks that likely need to be investigated. The grey-shaded area indicates baseline values for this metric, representing the expected value range during the selected time period. | |
Table 26. Response Time Trend view
The Transaction view displays overall response and availability information for the selected transaction. Use it to get a better idea of how well this Web site is performing and to investigate potential bottlenecks.
 o
o
The Transaction view appears on the right.
This view is made up of the following embedded views:
|
|
Shows general details about the most recent collection attempt. |
|
|
|
• |
Deployed Locations. The names of the hosts running the instances of the Web Monitor Agent configured to monitor this Web site. |
|
• |
Last HTTP Status. The most recent HTTP status code, indicating the result of the most recent transaction with the monitored Web site. |
|
• |
Last Page Availability. The percentage of time the Web site was available when the Web Monitor Agent attempted to collect information from it during the most recent data collection attempt. |
|
• |
Last Response Time. The amount of time the Web Monitor Agent waited for a response from the monitored Web site during the most recent data collection attempt. |
|
• |
Last Sample Location. The name of the host running the Web Monitor Agent instance that performed the most recent data collection from this Web site. |
|
|
|
Indicates the general success rate the monitoring agents encountered during data collection. |
|
|
|
• |
Availability. The percentage of time the Web site was available when the Web Monitor Agent instances configured to monitor this Web site attempted to collect information. |
|
• |
Total Errors. The total number of execution attempts that resulted in errors all instances of the Web Monitor Agent configured to monitor this Web site encountered during the selected time range. |
|
• |
Total Executions. The total number of execution attempts all instances of the Web Monitor Agent configured to monitor this Web site performed during the selected time range. |
|
• |
Total Successes. The total number of successful execution attempts all instances of the Web Monitor Agent configured to monitor this Web site encountered during the selected time range. | |
|
|
Indicates the time the Web site takes for responding to monitoring requests and its health. |
|
|
|
• |
Health History. A color-coded bar, representing the alarm state of the monitored location over the selected time range. The color of the bar changes depending on the alarm state. Red indicates a Fatal state, orange indicates Critical, yellow means Warning, and green is the Normal State. |
|
• |
Response Time. The amount of time the Web site takes to respond to monitoring requests, over the selected time range. High values in the graph can indicate potential bottlenecks that likely need to be investigated. The grey-shaded area indicates baseline values for this metric, representing the expected value range during the selected time period. | |
Table 27. Response Time Distribution view
The Transaction view displays overall response and availability information for the selected transaction. Use it to get a better idea of how well this Web site is performing and to investigate potential bottlenecks.
 o
o
The Transaction view appears on the right.
This view is made up of the following embedded views:
|
|
Shows general details about the most recent collection attempt. |
|
|
|
• |
Deployed Locations. The names of the hosts running the instances of the Web Monitor Agent configured to monitor this Web site. |
|
• |
Last HTTP Status. The most recent HTTP status code, indicating the result of the most recent transaction with the monitored Web site. |
|
• |
Last Page Availability. The percentage of time the Web site was available when the Web Monitor Agent attempted to collect information from it during the most recent data collection attempt. |
|
• |
Last Response Time. The amount of time the Web Monitor Agent waited for a response from the monitored Web site during the most recent data collection attempt. |
|
• |
Last Sample Location. The name of the host running the Web Monitor Agent instance that performed the most recent data collection from this Web site. |
|
|
|
Indicates the general success rate the monitoring agents encountered during data collection. |
|
|
|
• |
Availability. The percentage of time the Web site was available when the Web Monitor Agent instances configured to monitor this Web site attempted to collect information. |
|
• |
Total Errors. The total number of execution attempts that resulted in errors all instances of the Web Monitor Agent configured to monitor this Web site encountered during the selected time range. |
|
• |
Total Executions. The total number of execution attempts all instances of the Web Monitor Agent configured to monitor this Web site performed during the selected time range. |
|
• |
Total Successes. The total number of successful execution attempts all instances of the Web Monitor Agent configured to monitor this Web site encountered during the selected time range. | |
|
|
Indicates the time the Web site takes for responding to monitoring requests and its health. |
|
|
|
• |
Health History. A color-coded bar, representing the alarm state of the monitored location over the selected time range. The color of the bar changes depending on the alarm state. Red indicates a Fatal state, orange indicates Critical, yellow means Warning, and green is the Normal State. |
|
• |
Response Time. The amount of time the Web site takes to respond to monitoring requests, over the selected time range. High values in the graph can indicate potential bottlenecks that likely need to be investigated. The grey-shaded area indicates baseline values for this metric, representing the expected value range during the selected time period. | |