지금 지원 담당자와 채팅
지원 담당자와 채팅

Foglight for Infrastructure 5.9.4 - Infrastructure Utilities User Guide

Monitoring Web transactions Monitoring network devices

Summary - Single Device Summary view

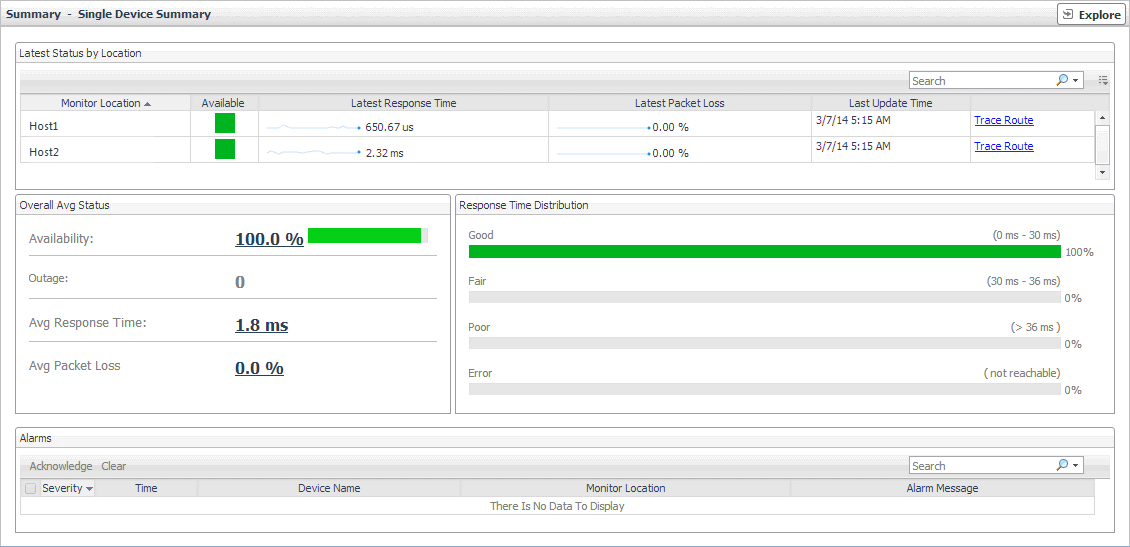
The Summary - Single Device Summary view provides an overview of the selected network device. Use it to find out the latest data collection statistics from each monitoring location, and to review its overall health.

2
On the Monitor tab, in the Net Monitor Environment view, select the Network Devices tile.
3
In the Quick View, in the Network Devices view, select a network device.
The Summary - Single Device Summary view appears on the right.

This view is made up of the following embedded views:

For more information, see Alarms view.

Lists the hosts from which the selected network device is monitored.

Available. A color-coded bar, representing the availability of the device over the selected time range. The color of the bar changes depending on the alarm state. Red indicates a Fatal state, orange indicates Critical, yellow means Warning, and green is the Normal state.
Latest Packet Loss. The percentage of data packets sent to the monitored device that are not echoed back in the most recent collection period. By default, the monitoring agent sends five data packets to the monitored network device. The number of data packets the Net Monitor Agent sends to monitored devices is specified in the Net Monitor Agent properties.
Latest Response Time. The round-trip response time between the monitoring agent and the network device in the most recent collection period.
Monitoring Location. The name of the host from which the selected network device is monitored.

Drill down on:

Trace Route Now. For more information, see Trace Result view.

Shows how well the selected network device is responding to the data collection requests from all of its monitoring locations.

Availability. The percentage of time the selected network device was available for monitoring, followed by a color-coded bar, representing the availability of the device over the selected time range. The color of the bar changes depending on the device availability. Orange indicates a device outage, green means a normal state, white means that no monitoring occurred.
Avg Packet Loss. The percentage of time that the data packets sent to the monitored device are not echoed back, over the selected time range. By default, the monitoring agent sends three data packets to the monitored network device. The number of data packets the Net Monitor Agent sends to monitored devices is specified in the Net Monitor Agent properties.
Avg Response Time. The round-trip response time between the monitoring agent and the network device, over the selected time range.
Outage. The number of times the selected network device was unresponsive to data collection requests, followed by the total outage duration.

Drill down on:

Availability, Avg Packet Loss, or Outage. For more information, see Device Detail view.

The distribution of the device response times in each of the available categories: Good, Fair, Poor, and Error.

Error. The percentage of times the network device was unresponsive.
Good: The percentage of times the network device takes between zero and the expected response time configured for the device.
Fair: The percentage of times the network device takes between the expected response time configured for the device and the expected response time, times the rate to respond to data collection requests.
Poor: The percentage of times the network device takes between higher than expected response time configured for the device, times the rate to respond to data collection requests.

Trace Result view

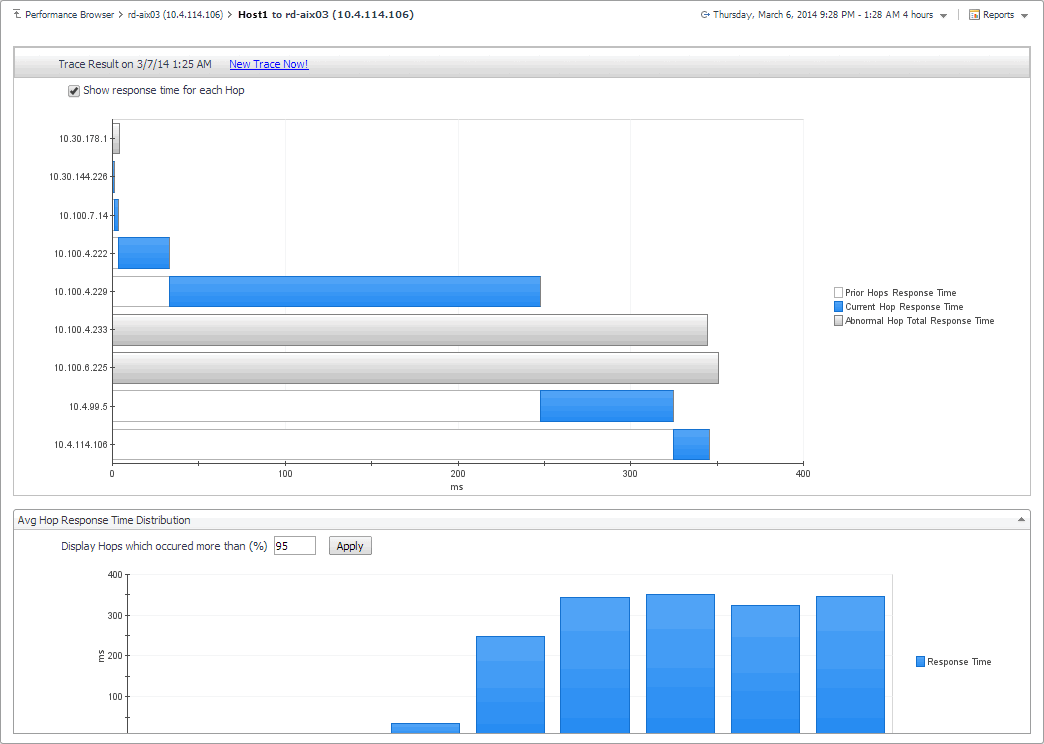
The Trace Result view displays the length of the hops on a packet’s route to its destination, and the distribution of average response times for each hop. Use this information to investigate a device with longer than expected response times and to identify the points in the route that may be the cause of the data packet delay.

2
On the Monitor tab, in the Net Monitor Environment view, select the Network Devices tile.
3
In the Quick View, in the Network Devices view, select a network device.
4
In the Summary - Single Device Summary view, in the embedded Latest Status by Locations view, in the row containing a monitored location whose route to the selected network device you want to trace, click Trace Route.
The Trace Result view appears in the display area.
IMPORTANT: If the trace route option is disabled in the device settings (see Viewing and editing individual network device details), this page is not populated with data. You can quickly execute a trace route in real time on this page by clicking Trace Route Now.

This view is made up of the following embedded views:

Displays a chart showing the hop response times for the selected route. Each route consists of one or more hops. A hop is the route between one network device and the next on a packet’s way to its destination. A hop destination is a device through which the packet passes on the route.

Prior Hops Response Time. When Show response time for each Hop is selected, this area in the chart represents the length of time the data packets take to travel from the monitoring location to this device.
Current Hops Response Time. When Show response time for each Hop is selected, this area in the chart represents the length of time the data packets take to travel from the previous device to this device, on the way to its destination.
Abnormal Hops Response Time. When Show response time for each Hop is selected, this area in the chart represents the length of time the data packets take to travel from the monitoring location to this device, that result in an error.
Response Time. When Show response time for each Hop is cleared, this area in the chart represents the length of time the data packets take to travel from the monitoring location to this device, on the way to its destination.

The distribution of the device response times for each hop that occurred more than a selected percentage of times.

NOTE: Use the Display Hops which occurred more than (%) box to specify a desired percentage.
Response Time. These areas in the chart represent the length of time the network device takes to send the data packet from the monitoring location to this device, on the way to its destination.


관련 문서

The document was helpful.

평가 결과 선택

I easily found the information I needed.

평가 결과 선택