The Kubernetes Nodes Summary view appears on the right when you select a node in the Kubernetes Nodes tree view.
The Kubernetes Nodes Summary view displays the following data:
|
• |
Resource Entitlement: The resource allocation for the selected Kubernetes node over a selected period of time, which includes the following: |
|
• |
CPU Allocatable: Shows the current allocatable CPU resources of this node. |
|
• |
Memory Allocatable: Shows the current allocatable Memory resources of this node. |
|
• |
CPU Request and Limit: Shows the trend of CPU request, limit, and capacity of this node. |
|
• |
Memory Request and Limit: Shows the trend of Memory request, limit, and capacity of this node. |
|
• |
Resource Utilizations: The resource utilization for the selected Kubernetes node over a selected period of time, which includes the following: |
|
• |
|
• |
|
• |
Total Network I/O: shows the sending, receiving, and transferring rate in byte/s, aggregated from all interfaces. |
|
• |
Filesystem Utilization: shows the filesystem utilization. |
|
• |
Total Disk I/O Load: shows the number of IOs in progress per second, aggregated from all disk devices. |
|
• |
Total Disk I/O Latency: shows the read and write latency in percentage. |
|
• |
|
|
• |
Summary: Displays the detailed information about the selected Kubernetes node, including Name, Pod CIDR, OS, Architecture, OS Image, Address, Capacity, Allocatable, and Status. |
Click Explore on the upper right of the Kubernetes Nodes Summary view to open the Nodes Explorer view, which shows more detailed information about this Kubernetes node.
|
• |
Explore to VMware VM: Click the button to open the VMware Explorer view, which is the same view from VMware cartridge. The Explore to xx button varies from the cartridge that is monitoring the machines. Currently, the supported cartridges include: VMware, Infrastructure, AWS, and Azure. |
The Nodes Explorer view opens when you click Explore in the Kubernetes Nodes Summary view, which includes the following tabs:
|
• |
General tab: The General tab displays the overall information of the selected Kubernetes node over a selected period of time, including the Summary and Resource Information table and the Pods table. For more information, see Node metrics . |

|
• |
Metrics tab: The Metrics tab displays a Metric Selector allowing you to choose the metrics to be plotted on this dashboard. Charts of CPU Usage, Utilization, Memory Usage, and Network I/O are presented by default. |

|
• |
Events tab: The Events tab lists all the events occur on the nodes. |

Kubernetes workload is a group of Kubernetes resources. It includes the following Kubernetes resources types: deployment, daemon set, stateful set, replica set, replication controller, cron job, job, and pod. The Kubernetes Workloads Quick View, which appears after clicking Monitoring > Workloads, shows the data collected about the selected clusters and namespaces. This view consists of the following two panes:
|
• |
The Kubernetes Workloads tree view, which appears on the left of Kubernetes Workloads Quick View, lists the workloads existing in the monitored Kubernetes environment. The menu level differs from different workload types, following are some examples of the menu levels: |
|
• |
The Kubernetes Pods Summary view, which appears on the right after you select an individual pod in the Kubernetes Workloads tree view. |
The Kubernetes Workloads Summary view appears on the right when you select a workload in the Kubernetes Workloads tree view.
The Kubernetes Workloads Summary view displays the following data:
|
• |
Resource Utilizations: The resource utilization for the selected Kubernetes Workloads over a selected period of time, which includes the following: |
|
• |
CPU Utilization: The CPU utilization is calculated as the percentage of CPU usage rate and limit, and it will be unset or blank if the CPU limit is not configured. |
|
• |
Memory Utilization: The Memory utilization is calculated as the percentage of memory usage and limit, and it will be unset or blank if the memory limit is not configured. |
|
• |
Total Network I/O (Bytes Rate): transferring, sending, and receiving rate in bytes. |
|
• |
Filesystem Utilization: temporary filesystem utilization. |
|
• |
Summary: Displays the detailed information about the selected Kubernetes workload. The listed information might vary from different types of workload. |
|
• |
Alarms: Displays the alarms aggregated from the pod and the current workload related to the pod. |
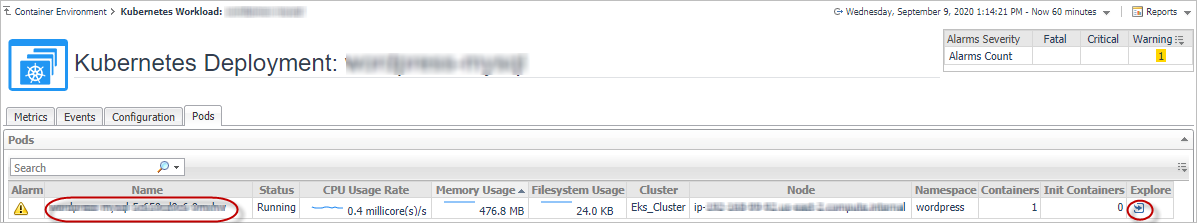
Click Explore on the upper right of the Kubernetes Workloads Summary view to open the Workloads Explorer view, which shows more detailed information about this Kubernetes workload.
The Workloads Explorer view opens when you click Explore in the Kubernetes Workloads Summary view, which includes the following tabs:
|
• |
Metrics tab: The Metrics tab displays a Metric Selector allowing you to choose the metrics to be plotted on this dashboard. Charts of Utilization, CPU Usage and Quota, Memory Usage and Quota, Total Network I/O, Total Filesystem Usage, and Filesystem Utilization by Device are presented by default. |

|
• |
Events tab: The Event tab lists all the events occur on the workloads. It will not aggregate the alarms from other related workloads. |
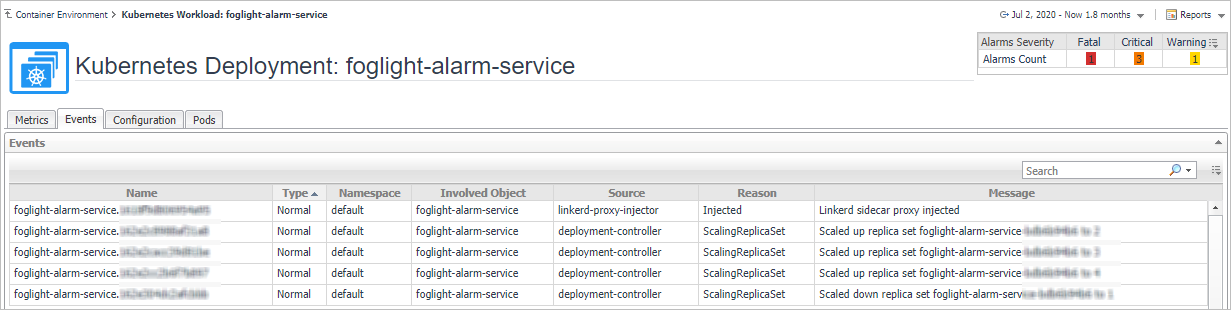
|
• |
Configuration tab: The Configuration tab displays the overall information of the selected Kubernetes Workload over a selected period of time. It includes the following tables: |

|
• |
Pods tab: The Pods tab displays the related Pods of the workload. This tab is not displayed if the workload type is a Pod. |

|
• |
Metrics tab on Container Dashboard |

|
• |
Configurations tab on Container Dashboard |

A pod contains one or multiple containers, such as Docker containers, which contains storage/network and the specification about how to run the containers. The Kubernetes Pods Quick View, which appears after clicking Monitoring > Pods, shows the data collected about the selected clusters and namespaces. This view consists of the following two panes:
|
• |
The Kubernetes Pods tree view, which appears on the left of Kubernetes Pods Quick View, lists the pods existing in the monitored Kubernetes environment. |
|
• |
The Kubernetes Pods Summary view, which appears on the right after you select an individual pod in the Kubernetes Pods tree view. |


