Monitoring the Replication Agents
This drilldown contains the following sections:
|
• |
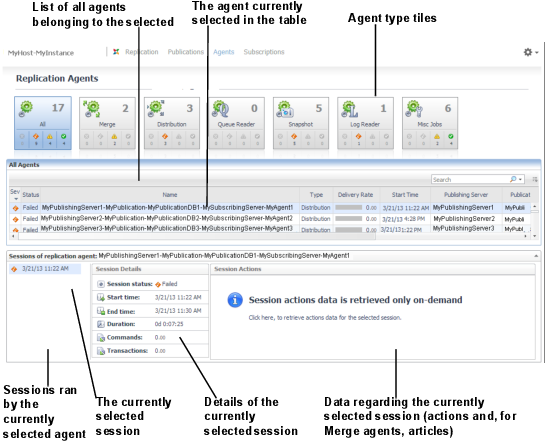
Agent type tiles — used for configuring the list displayed on the Agents table; either displaying all agents by clicking All, or filtering the display by agent type or severity level. |
|
• |
|
• |
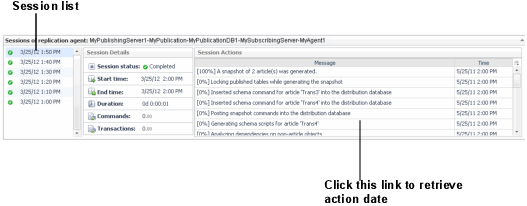
Except for agents of type Misc. Jobs, clicking each agent row displays the sessions ran by the selected agent during the specified time range. For details, see Reviewing session activity data for the selected agent .
Monitoring the Replication Subscriptions
|
2 |
Review the requested publication data on the Subscriptions table: |
|
• |
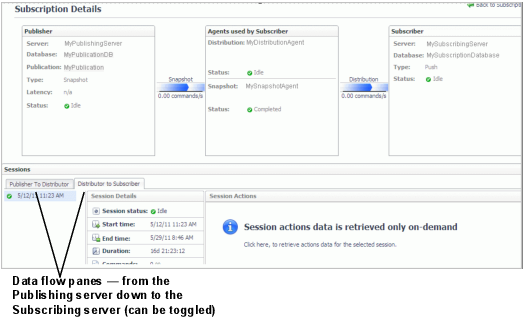
Click the subscription’s row to access the Subscription Details screen.
|
• |
|
• |
|
• |
|
• |
|
• |
In Transactional with update publications — Snapshot, Log Reader, and Queue Reader. |
|
• |
Subscription status — can have one of the following values: Running, Failed, Retrying, Idle, and Not started. |
|
• |
Publisher to Distributor — displays the session actions of the Snapshot or Log Reader agent. |
|
• |
Distributor to Subscriber — displays the Distribution agent’s session actions. |
Monitoring Alarms
The Alarms pane contains a table that displays only replication-related alarms, invoked if the metrics defined in the replication-related rules have been exceeded during the specified time range (by default: the last 60 minutes). For a detailed list of such alarms, see Replication-related alarms .
|
The metric (or workload resource) has exceeded a threshold or extremely deviated from the baseline. | |
The replication-related alarms are as follows:
For details, see the Foglight for SQL Server Reference Guide.
Monitoring SQL Performance
The SQL Performance page displays the following components:
|
• |
The Instance View — Provides the ability to investigate and analyze the resource consumption of the instance. |
|
• |
The Resource toolbar — By selecting one of the resources, the resource consumptions charts and the overview section are updated to display only the relevant information regarding the activity of the selected resource. |


