지금 지원 담당자와 채팅
지원 담당자와 채팅

Foglight for Java EE Technologies 5.9.13 - Application Servers User Guide

Monitoring Application Servers Monitoring Systems Monitoring Servers Monitoring Deployed Applications Monitoring Requests Managing Traces Using Object Tracking to Locate Memory Leaks Monitoring Methods Application Servers Monitor Views
JVM view Method Groups view Request Types view Entity EJBs view Message Driven EJBs view Stateful Session EJBs view Stateless Session EJBs view Deployed Applications view JSPs/Servlets components view Resource Adapters components view Web Applications components view Web Services components view .NET views JBoss Services views Oracle Services views Tomcat Services views WebLogic Services views WebSphere Services views JMX Administration dashboard JMX Explorer dashboard
Appendix: Regular Expressions

Monitoring Application Servers

This Foglight for Application Servers User Guide provides instructions and conceptual information about how to monitor and display .NET and Java EE Technologies metrics, and JMX metrics from JMX-enabled systems.

In addition, this guide provides information about the Application Servers Administration and Monitor dashboards and views. This guide is intended for any user who is interested in monitoring .NET or Java EE systems, or JMX data with Foglight for Microsoft .NET, Foglight for Java EE Technologies, or Foglight for JMX. Guides that are common to these three products are called the Foglight for Application Servers guides.

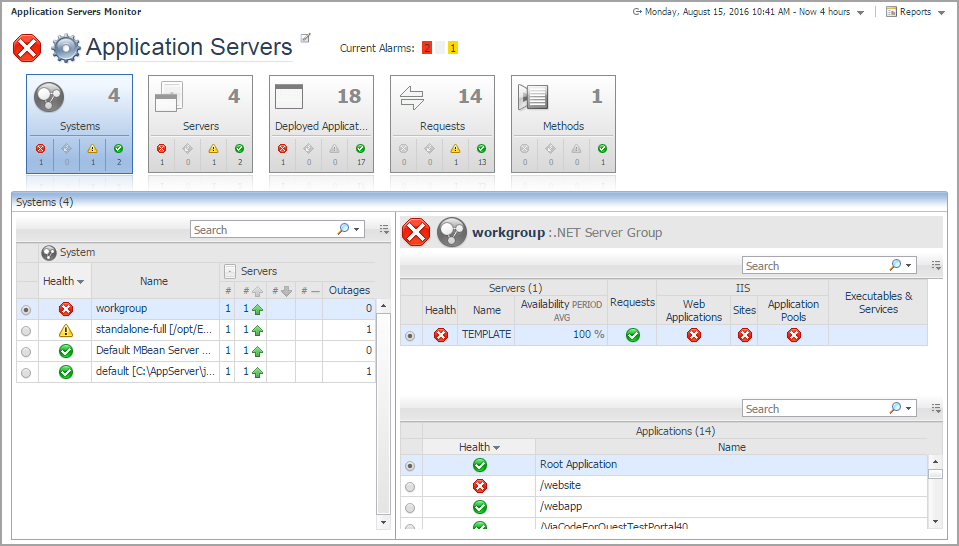
The Application Servers Monitor dashboard provides a centralized location for monitoring your .NET, Java EE Technologies, and JMX systems, servers, deployed applications, requests, and methods. From this dashboard, you can view the health status of your monitored components, and investigate any alarms that occur.

The Application Servers Monitor dashboard displays services as defined by the default Application Servers service category. The Application Servers category contains all Java EE, JMX, and .NET services.

If you want to view only a specific subset of services (such as only All .NET Systems), you can select the service.

1
2
On the Application Servers Monitor dashboard, click the edit icon .
3
In the Service Selection dialog box that opens, select the name of the service you want to display on the dashboard.
4

You can select a different service to view at any time using the same procedure. You can also create your own services.

Using the Application Servers Monitor dashboard

The Application Servers Monitor dashboard organizes your .NET and Java EE Technologies monitoring data into views that are divided into five categories: Systems, Servers, Deployed Applications, Requests, and Methods. These categories are presented as tiles on the dashboard.

Click a tile to access the views for that category. For more information, see:

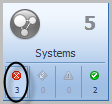
If you want to view only the components that have triggered alarms for that category, click the health status icon on the tile.

The health status icons act as a filter for the category, allowing you to focus on trouble spots within your system.

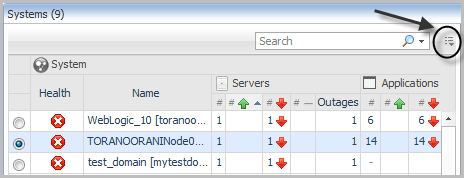
Some columns are not visible by default. You can use the customizer menu to show all available columns, or to reduce the number of columns shown if the information is not pertinent to your monitoring needs.

3
Click Apply.

Reviewing alarms

On the Application Servers Monitor dashboard, click the number next to Current Alarms: to open the Alarm Summary dialog box that lists the details of the current alarms.

Use these links to access more detailed information about the alarms affecting your monitored services.

For more information about managing alarms, see Viewing, Acknowledging, and Clearing Alarms in the Foglight User Help.

Managing services

In Foglight, a service is defined as a grouping of one or more monitored components, such as Java Service Pages (JSPs), servlets, and Enterprise Java Beans (EJBs). Services can be nested within other services, each with their own monitored components. Application Server (Java EE and .NET) services are organized by predefined types such as: all monitored domains, WebSphere cells, OracleAS cluster topologies, JBoss partitions, Tomcat servers, or web applications.

셀프 서비스 도구
지식 기반
공지 및 알림
제품 지원
소프트웨어 다운로드
기술 설명서
사용자 포럼
비디오 자습서
RSS 피드
문의처
라이센싱 지원가져오기
기술 지원
모두 보기
관련 문서

The document was helpful.

평가 결과 선택

I easily found the information I needed.

평가 결과 선택