지금 지원 담당자와 채팅
지원 담당자와 채팅

Foglight for Infrastructure 5.9.2 - Infrastructure Utilities User Guide

Monitoring Web transactions Monitoring network devices

Quick View

The Quick View is a container view. It contains a combination of location or transaction views, depending on your selection in the Net Monitor Environment view and the panel on the left. Use it to understand the performance of the monitored network devices, and to investigate any issues that they may be experiencing.
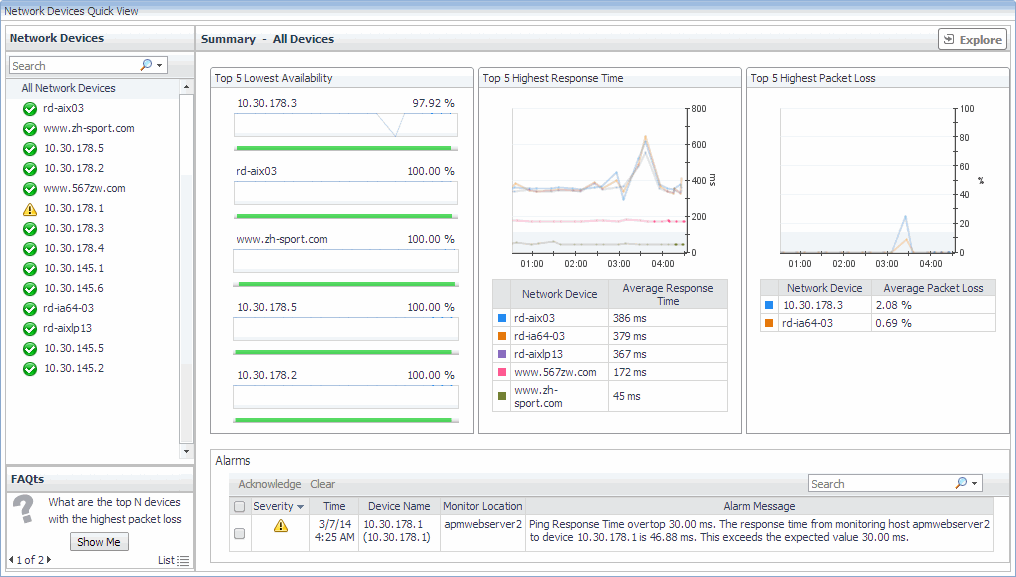
This view appears in the Performance Browser, just below the Net Monitor Environment view.

This view contains a combination of some of the following views, depending on your previous selections:

Single Location Summary view

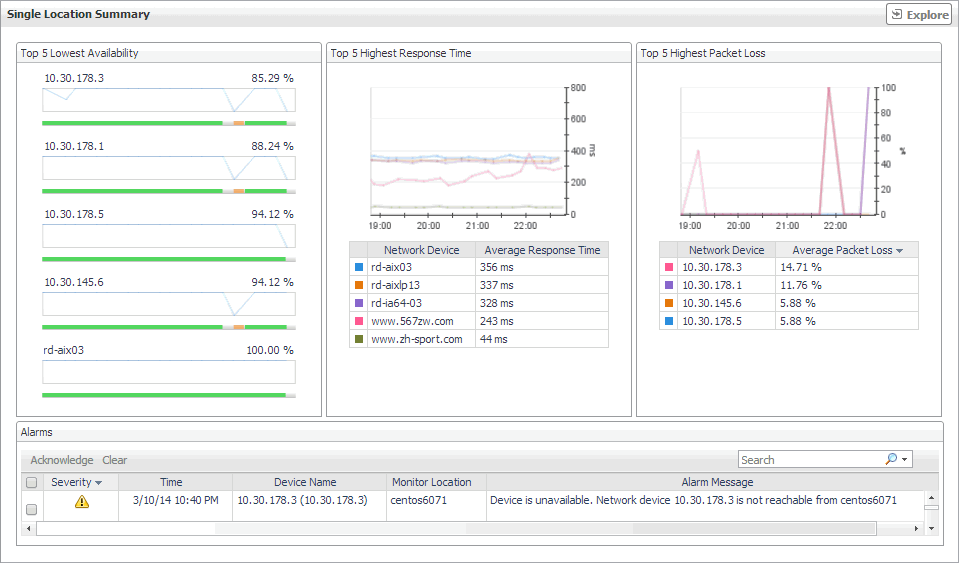
The Single Location Summary view displays overall response and availability information for the network devices monitored from the selected location. It identifies the network devices with the lowest availability, highest response time, and highest data packet loss, showing the top five transactions in each of these categories. Use this view to identify the network devices with performance disruptions, and to investigate them further.
2
On the Monitor tab, in the Net Monitor Environment view, select the Monitor Locations tile.
3
In the Quick View, in the Monitor Locations view, select a monitoring location.
The Single Location Summary view appears on the right.

This view is made up of the following embedded views:

For more information, see Alarms view.

Identifies the top five network devices that are monitored from the selected location and have the highest data packet loss.

Average Packet Loss. The average percentage of time that the data packets sent to the monitored device from the selected location are not echoed back. By default, the monitoring agent sends five data packets to the monitored network device. The number of data packets the Net Monitor Agent sends to monitored devices is specified in the Net Monitor Agent properties.
Network Device. The IP address of the monitored network device.

Identifies the top five network devices with the highest response time that are monitored from the selected location.

Avg Response Time. The average round-trip response time between the selected monitoring location and the network device.
Network Device. The IP address of the monitored network device.

Identifies the top five network devices that are monitored from the selected location and have the lowest availability.

Availability. A sparkline and a color-coded bar, indicating the levels of availability of the network device over the selected time range.
Network Device. The IP address of the monitored network device, followed by the percentage of its average availability.

Summary - All Devices view

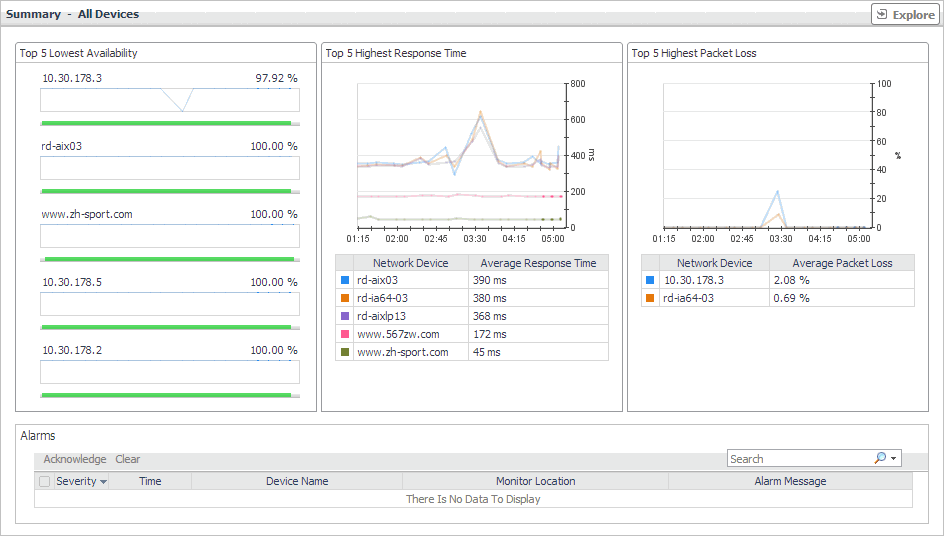
The Summary - All Devices view displays overall response and availability information for all monitored network devices. It identifies the network devices with the lowest availability, highest response time, and highest data packet loss, showing the top five network devices in each of these categories. Use this view to identify the devices with performance degradation, and to investigate them further.
2
On the Monitor tab, in the Net Monitor Environment view, select the Network Devices tile.
3
In the Quick View, in the Network Devices view, select All Network Devices.
The Summary - All Devices view appears on the right.

This view is made up of the following embedded views:

For more information, see Alarms view.

Identifies the top five network devices with the highest data packet loss.

Average Packet Loss. The average percentage of time that the data packets sent to the monitored device are not echoed back. By default, the monitoring agent sends five data packets to the monitored network device. The number of data packets the Net Monitor Agent sends to monitored devices is specified in the Net Monitor Agent properties.
Network Device. The IP address of the monitored network device.

Identifies the top five network devices with the highest response time.

Avg Response Time. The average round-trip response time between the network device and its monitoring locations.
Network Device. The IP address of the monitored network device.

Identifies the top five network devices with the lowest availability.

Availability. A sparkline and a color-coded bar, indicating the levels of availability of the network device over the selected time range.
Network Device. The IP address of the monitored network device, followed by the percentage of its average availability.

Summary - All Monitor Locations view

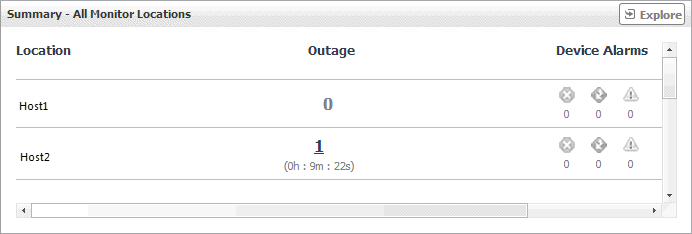
The Summary - All Monitor Locations view displays a list of existing monitoring locations, identifies the periods of time that each device was unavailable, and shows the counts of alarms generated for each location, if applicable.
2
On the Monitor tab, in the Net Monitor Environment view, select the Monitor Locations tile.
3
In the Quick View, in the Monitor Locations view, select All Monitor Locations.
The Summary - All Monitor Locations view appears on the right.
Location. The name of the host from which network devices are monitored.
Outage. The number of times any network devices was unresponsive to data collection requests, followed by the total outage duration.
Device Alarms. The counts of alarms generated against the monitoring device in each alarm state: Normal , Warning , Critical , or Fatal .

Drill down on:

Outage. Displays the Outage Detail dialog box.
관련 문서

The document was helpful.

평가 결과 선택

I easily found the information I needed.

평가 결과 선택