Dependencies tab
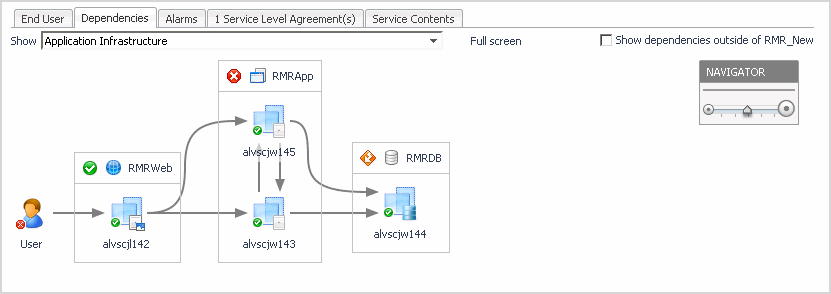
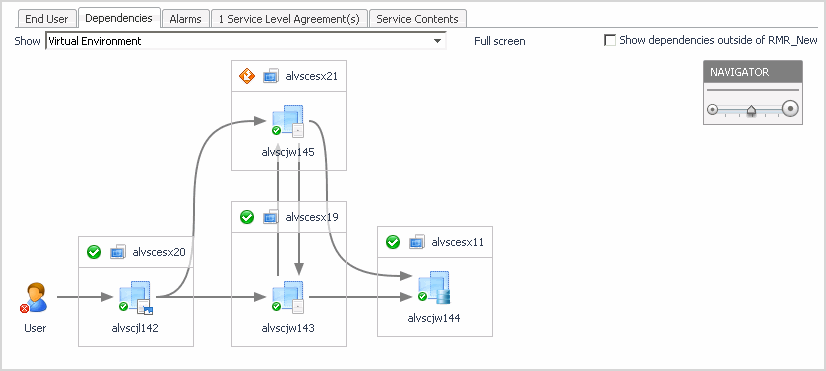
The Dependencies tab focuses on observed (or manually asserted) relationships between elements (or elements contained within a service). On this tab, monitor service dependencies with the following rollup levels:
|
• |
|
• |
Select a service from the list of services already defined in your system (use the Select a service drop-down list). |
|
• |
Select the rollup level to show for the selected service (use the Show drop-down list). |
|
• |
Display any objects that are outside the selected service (use the Show dependencies outside of <service_name> check box). |
|
• |
Return to the Service Operations Console dashboard by clicking Service Operations Console in the breadcrumb trail. |
In the Dependencies tab, you can also display any objects that are outside a selected service but have observed dependencies with other objects inside that service.
|
• |
Select the Show dependencies outside of <service_name> check box in the upper-right corner of the tab. |
In the upper-right corner, the Dependencies tab provides a NAVIGATOR slider. Use the slider to set the zoom level between 50% and 150%.
Summary tab
The information presented in this tab varies depending on the selected component. See Dependencies tab.
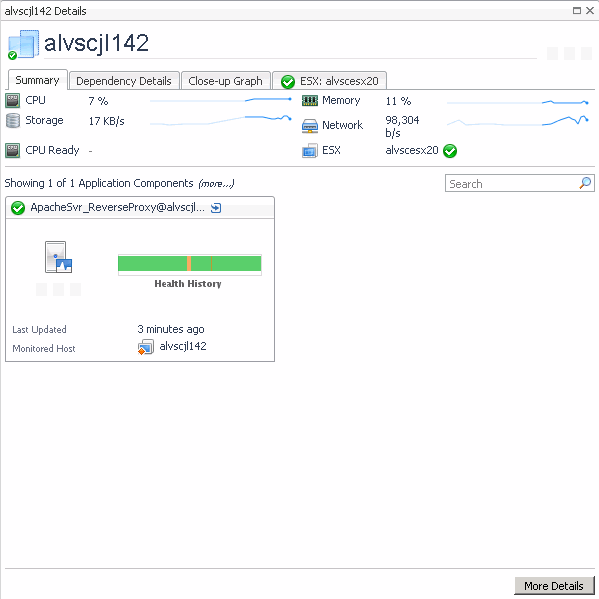
The following illustration shows an example of information provided for a host that has one application component. The banner (upper part of the tab) displays the CPU, Storage, Memory, and Network allocations for this host. The lower part of the tab displays a tile associated with the application component related to the host. The content of this tile is specific to the application component type. For detailed information about tiles and their content, see the Foglight for Application Operations User Guide.
From this tab you can navigate to the Host Monitor dashboard by clicking More Details. Use the Host Monitor dashboard to further investigate the performance of the host.
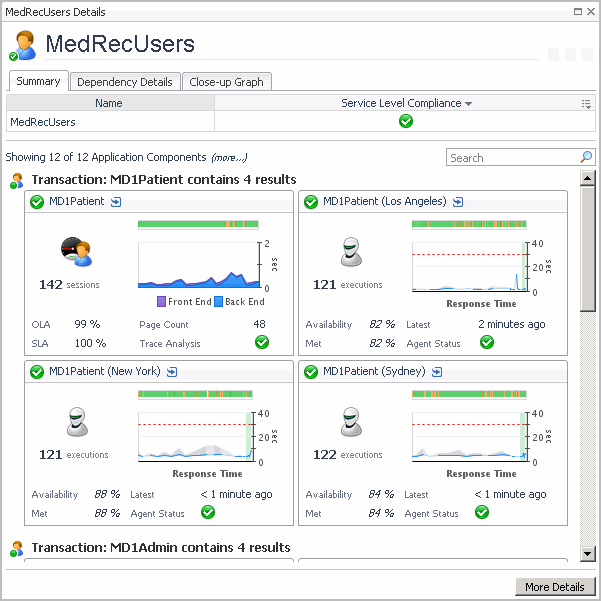
The following illustration shows an example of information provided for a host that includes several application components. The banner (upper part of the tab) displays the host name, and the Service Level Compliance status. The lower part of the tab displays a tile for each application component related to the host. The content of these tiles is specific to the application component type. For detailed information about tiles and their content, see the Foglight for Application Operations User Guide.
From this tab you can navigate to the Service Details dashboard by clicking More Details. Use this dashboard to further investigate the performance of the selected service.
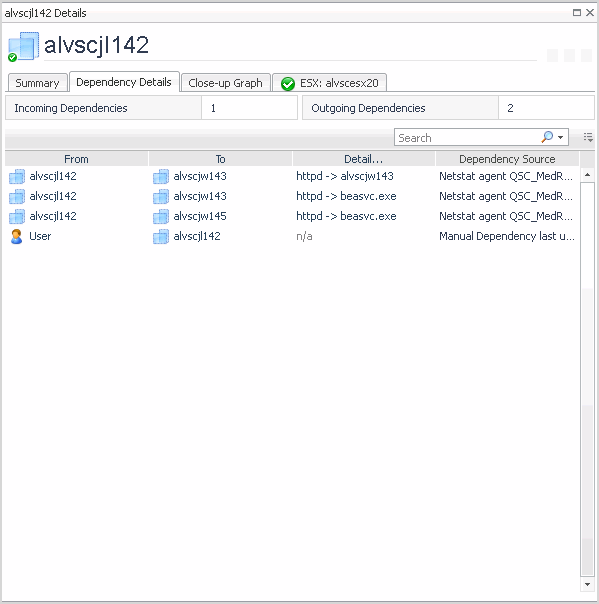
Dependency Details tab
This tab presents detailed information about the dependencies observed for the selected host, and the number of incoming and outgoing dependencies. For more information, see Dependencies tab.
|
The host or object which is directly dependent on the item in the To column (that is, the dependency client). | |
|
The host or object which is directly depended upon by the item in the From column (that is, the dependency server). | |
|
Short text summary of the dependency (for example, httpd.exe->mysql.exe), or the comment of the creator of the manual dependency. Click the details link to open the Dependency Detail dialog box. For more information, see Dependency detail. | |
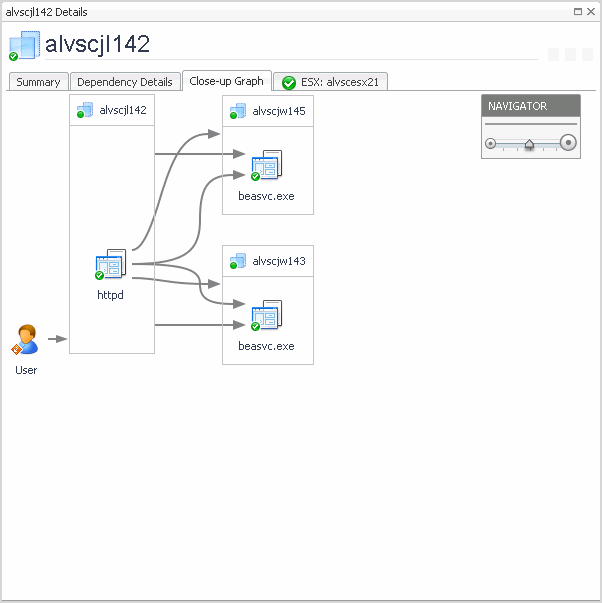
Close-up Graph tab
This tab shows the immediate dependencies for the selected host or service, along with one additional level of detail. For example, if you select a host and process information has been collected, this graph shows the processes involved in the host’s immediate dependencies grouped by host. For more information about selecting a host or service, see Dependencies tab.

