지금 지원 담당자와 채팅
지원 담당자와 채팅

DR Series Software 3.2.6 - Administrator Guide

Introduction to the DR Series System Documentation Understanding the DR Series System Setting Up the DR Series System Hardware Configuring the DR Series System Settings Managing DR Series Storage Operations Monitoring the DR Series System Using Global View Using the DR Series System Support Options Configuring and Using Rapid NFS and Rapid CIFS Configuring and Using Rapid Data Access with Dell NetVault Backup and with Dell vRanger Configuring and Using RDA with OST
Understanding RDA with OST Guidelines Terminology Supported RDA with OST Software and Components Best Practices: RDA with OST and the DR Series System Setting Client-Side Optimization Configuring an LSU Installing the RDA with OST Plug-In Configuring DR Series System Information Using NetBackup Backing Up Data From a DR Series System (NetBackup) Using Backup Exec With a DR Series System (Windows) Understanding the OST CLI Commands Understanding RDA with OST Plug-In Diagnostic Logs Collecting Diagnostics Using a Linux Utility Guidelines for Gathering Media Server Information
Configuring and Using VTL Configuring and Using Encryption at Rest Troubleshooting and Maintenance Supported Ports in a DR Series System Getting Help
The Active Directory page is displayed. Under Settings, “Active Directory is configured” should be displayed; if not, you must configure your ADS domain before proceeding.
2.
Click Add Login Group on the options bar.
The Active Directory Configuration dialog is displayed.
3.
In Login Group, type the name of the login group including the domain name; for example, Domain\Domain Admins. If your login group name contains spaces, you must not enclose it in quotation marks. (This differs from the equivalent CLI command.)
4.
Click Add Login Group to add the login group (or click Cancel to display the Active Directory page).

Changes made to the login group take effect on the next log in attempt (no active checking is done on the group, which matches how Windows ADS works).

About the Global View Page

About the Global View Page

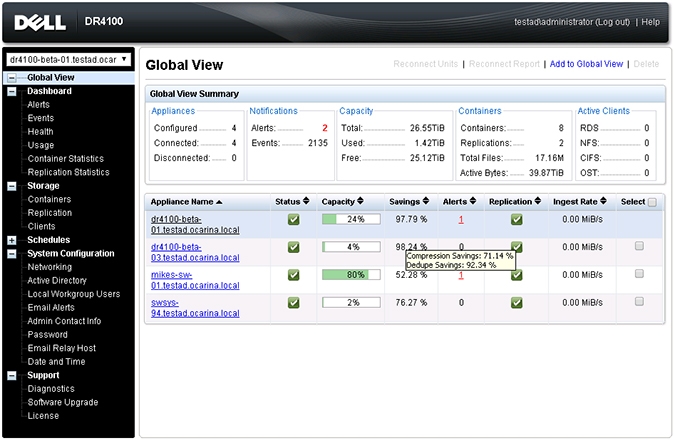
The Global View page displays a dashboard of operating statistics for all of the DR Series systems that you have added to the view. From this page, you can monitor the status of your enterprise as well as easily navigate to any DR Series system in your enterprise.

Figure 9. Global View Page (DR4100 System)

This figure shows a DR4100 system with the Global View page listing four DR systems.

Global View Summary

The following table describes the statistics available in the Global View Summary:

Table 2. Global View Summary

This table describes the statistics that are available in the Global View Summary section of the Global View page.

Item

Description

Appliances

Configured

Displays the number of appliances that were added to the Global View (including the system that contains the Global View dashboard)..

Connected

Displays the number of appliances that are currently connected in Global View.

Disconnected

Displays the number of appliances that were added to the Global View, but are unable to be reached. To troubleshoot, see Reconnecting DR Series Systems.

Notifications

Alerts

Displays the total number of alerts in all appliances in the Global View.

Events

Displays the total number of events in all appliances in the Global View.

Capacity

Total

Displays the total physical capacity in all appliances in the Global View.

Used

Displays the total physical capacity bytes that are used across all appliances in the Global View.

Free

Displays the total physical capacity bytes that are free across all appliances in the Global View.

Containers

Containers

Displays the total number of containers in all appliances in the Global View.

Replications

Displays the total number of containers replicated in all appliances in the Global View.

Total Files

Displays the total number of files in all containers in all appliances in the Global View.

Active Bytes

Displays the total bytes before optimization in all appliances in the Global View.

Active Clients

Displays the total clients configured in all appliances in the Global View, organized by container connection type.

Appliance List

This section lists all appliances in the Global View with a high-level snapshot of their status. By default, appliances are listed in alphabetic order by Appliance Name. You can sort the list by a particular column by clicking the column header, which toggles between ascending and descending sort order. This sort order is retained even if you leave the page and return later.

The following table describes the information displayed in the appliance list:

Item

Description

Appliance Name

Lists the Active Directory fully-qualified domain name (FQDN), and contains links to each respective DR Series system. Hover your mouse over the appliance name to display the following information:

Status

Displays the system operational state by using an icon.

A green icon This green icon displays a white check mark. indicates that the system is operational. Hovering your mouse over a greenStatus icon displays the message Operational.
A red icon This red icon displays a white x.indicates that the system is not connected. Hovering your mouse over a red Status icon displays the message Connect Failed. This can occur if the DR Series system is removed from the Active Directory Services (ADS) domain, if it is down, or being rebooted.

Capacity

Displays the used and free physical storage capacity in percentages and volume in Gibibytes and Tebibytes (GiBs and TiBs). The capacity appears as a progress bar with a percentage shown.

When the capacity is less than 90%, the capacity bar is green. After the capacity used reaches 90%, the capacity bar is shown in red.

Hover your mouse over the Capacity percentage bar to display the following information:

Savings

Displays the total savings as a percentage (combining both deduplication and compression) over a time period (in minutes). Hover your mouse over the Savings column value to display the following individual measures:

Compression Savings: The percentage of compression savings that was achieved on the data that could not be deduplicated.
Dedupe Savings: The percentage of data that was deduplicated.

Alerts

Displays the alert count as a link to the DR Series system’s Alert page.

Replication

Displays the replication state by using an icon.

A green icon This green icon displays a white check mark. indicates that replication is operational. Hovering your mouse over a green Replication icon displays the number of Total Containers, Configured Replications, and Failed Replications.
A red icon This red icon displays a white x.indicates that replication has failed. Hovering your mouse over a red Replication icon displays the message Replication Failed.

Ingest Rate

Displays the rate of data being written to the DR Series system across your network. Hover your mouse over the Ingest Rate to display the Read Throughput in Megabytes per second.

Navigating in Global View

Navigating in Global View

You can use the Global View navigation features to easily view DR Series systems in your enterprise without having to log out and log on using new browser sessions. To navigate to different DR Series systems in your Global View dashboard, do one of the following:

In the left navigation pane above Global View, use the drop-down list to select the DR Series system that you want to view.
In the appliance list on the Global View page, click the link of the DR Series system in the Appliance Name column.

The selected DR Series system is displayed in a new browser window. If you are using Internet Explorer 10, make sure the pop-up blocker is disabled in order to have the selected DR Series system open in a new browser window.

Adding a DR Series System to Global View

Adding a DR Series System to Global View

You can add up to 64 machines to your Global View dashboard. This number includes the system on which you are logged in.

Before you add a system to the Global View dashboard, you must have logged in to the system using your domain credentials and have added a login group in the domain. For details, see Prerequisites.

To add a DR Series system to Global View, complete the following:

In the left navigation pane, click Global View.
2.
On the Global View page, click Add to Global View.
The Add to Global View dialog box is displayed.
3.
In DR Unit FQDN or IP address, enter the fully-qualified domain name (FQDN) or IP address of the DR Series system that you want to add. Keep in mind that the system must be in the same ADS domain, in the same login group, and have identical credentials to the system on which you are working.
4.
In Domain Name (FQDN), the fully-qualified domain name should be already completed. If not, enter it.
5.
In Username, enter the domain username for the DR Series system that you want to add. For example, DOMAIN\administrator. This should be identical to the credentials used in all other systems in the Global View.
6.
In Password, enter the domain password for the DR Series system that you want to add. This should be identical to the credentials used in all other systems in the Global View.
7.
Click Add and Connect.
If successful, the Add to Global View dialog box displays “Successfully added DR unit: [name]” and remains open.
8.
관련 문서

The document was helpful.

평가 결과 선택

I easily found the information I needed.

평가 결과 선택