|
NOTE: In order for the Apache agent to monitor your web server, the server must have mod_info and mod_status enabled. For more information, see Configuring Apache web servers for monitoring . |
|
• |

|
4 |
|
5 |
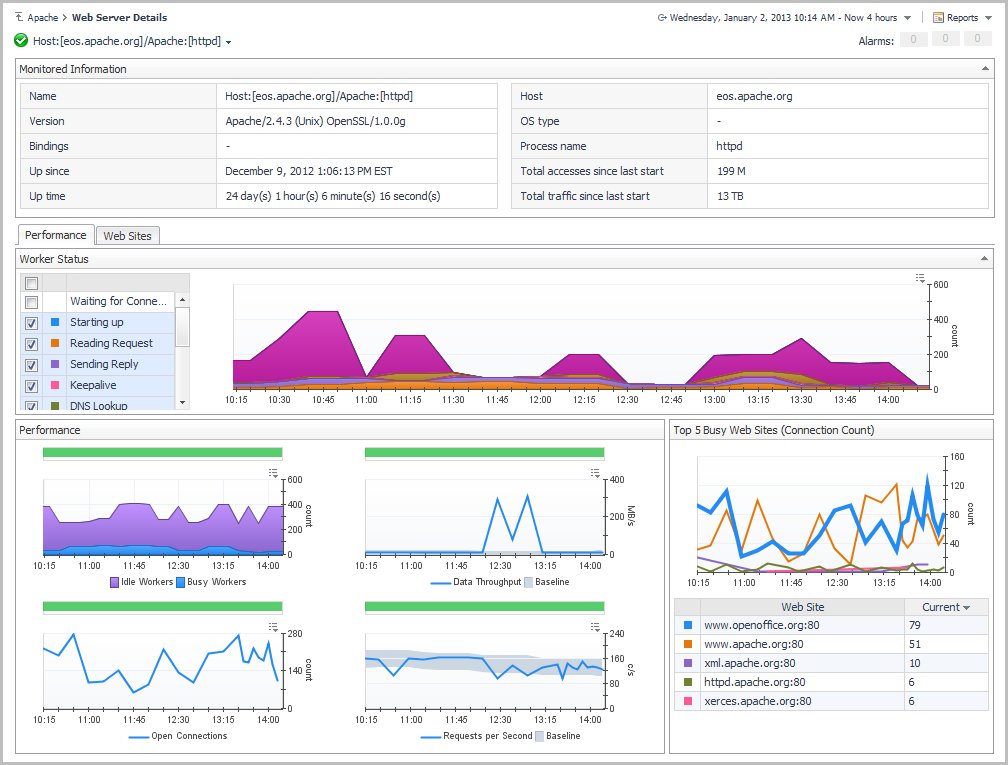
On the Performance tab: |
|
a |
Examine the workers status breakdown. Use the check boxes to the left of the chart to select the worker states to compare over time. By default, all states except Waiting for connections and Open slot with no current process are included. |
|
6 |
Click the Web Sites tab. |
|
1 |
On the navigation panel, click Administration. |
|
2 |

|
b |
|
TIP: For some of the questions, you can specify the number of results you want returned (for example, Top # Apache web servers with the highest requests per second). |

