Submitting forms on the support site are temporary unavailable for schedule maintenance. If you need immediate assistance please contact technical support. We apologize for the inconvenience.
라이브 도움말 보기
등록 완료
로그인
가격 산정 요청
영업 담당자에게 문의
제품 번들을 선택했습니다. 귀하의 요청에 더 적합한 서비스를 제공해 드릴 수 있도록 개별 제품을 선택해 주십시오. *
지금은 채팅에 회신할 수 있는 기술 지원 엔지니어가 없습니다. 즉각적인 서비스를 받으려면 당사의 서비스 요청 양식을 사용하여 요청을 제출하십시오.
다음 문서의 설명에 따라 문제를 해결할 수 있습니다.
SMART alerts SMART (Significant Multidimensional Anomaly Reduction Technology) is a correlation technology that provides prioritized results for dynamic and frequently changing behaviors. The technology uses statistical and machine learning algorithms to identify unique connections between anomalies, thereby reducing false positives and helping to spot threats. SMART prioritizes and consolidates threats that reflect a meaningful deviation in user behavior. As a result, while millions of raw events might yield discovery of thousands of threat indicators, only patterns of truly suspicious behavior are scored. This means that fewer alerts are raised in the Threat Detection dashboard, and fewer false positives are identified. Like baselines, SMART alerts improve over time as more log data is processed, so they deliver increasingly accurate user threat detection.
SMART (Significant Multidimensional Anomaly Reduction Technology) is a correlation technology that provides prioritized results for dynamic and frequently changing behaviors. The technology uses statistical and machine learning algorithms to identify unique connections between anomalies, thereby reducing false positives and helping to spot threats.
SMART prioritizes and consolidates threats that reflect a meaningful deviation in user behavior. As a result, while millions of raw events might yield discovery of thousands of threat indicators, only patterns of truly suspicious behavior are scored. This means that fewer alerts are raised in the Threat Detection dashboard, and fewer false positives are identified. Like baselines, SMART alerts improve over time as more log data is processed, so they deliver increasingly accurate user threat detection.
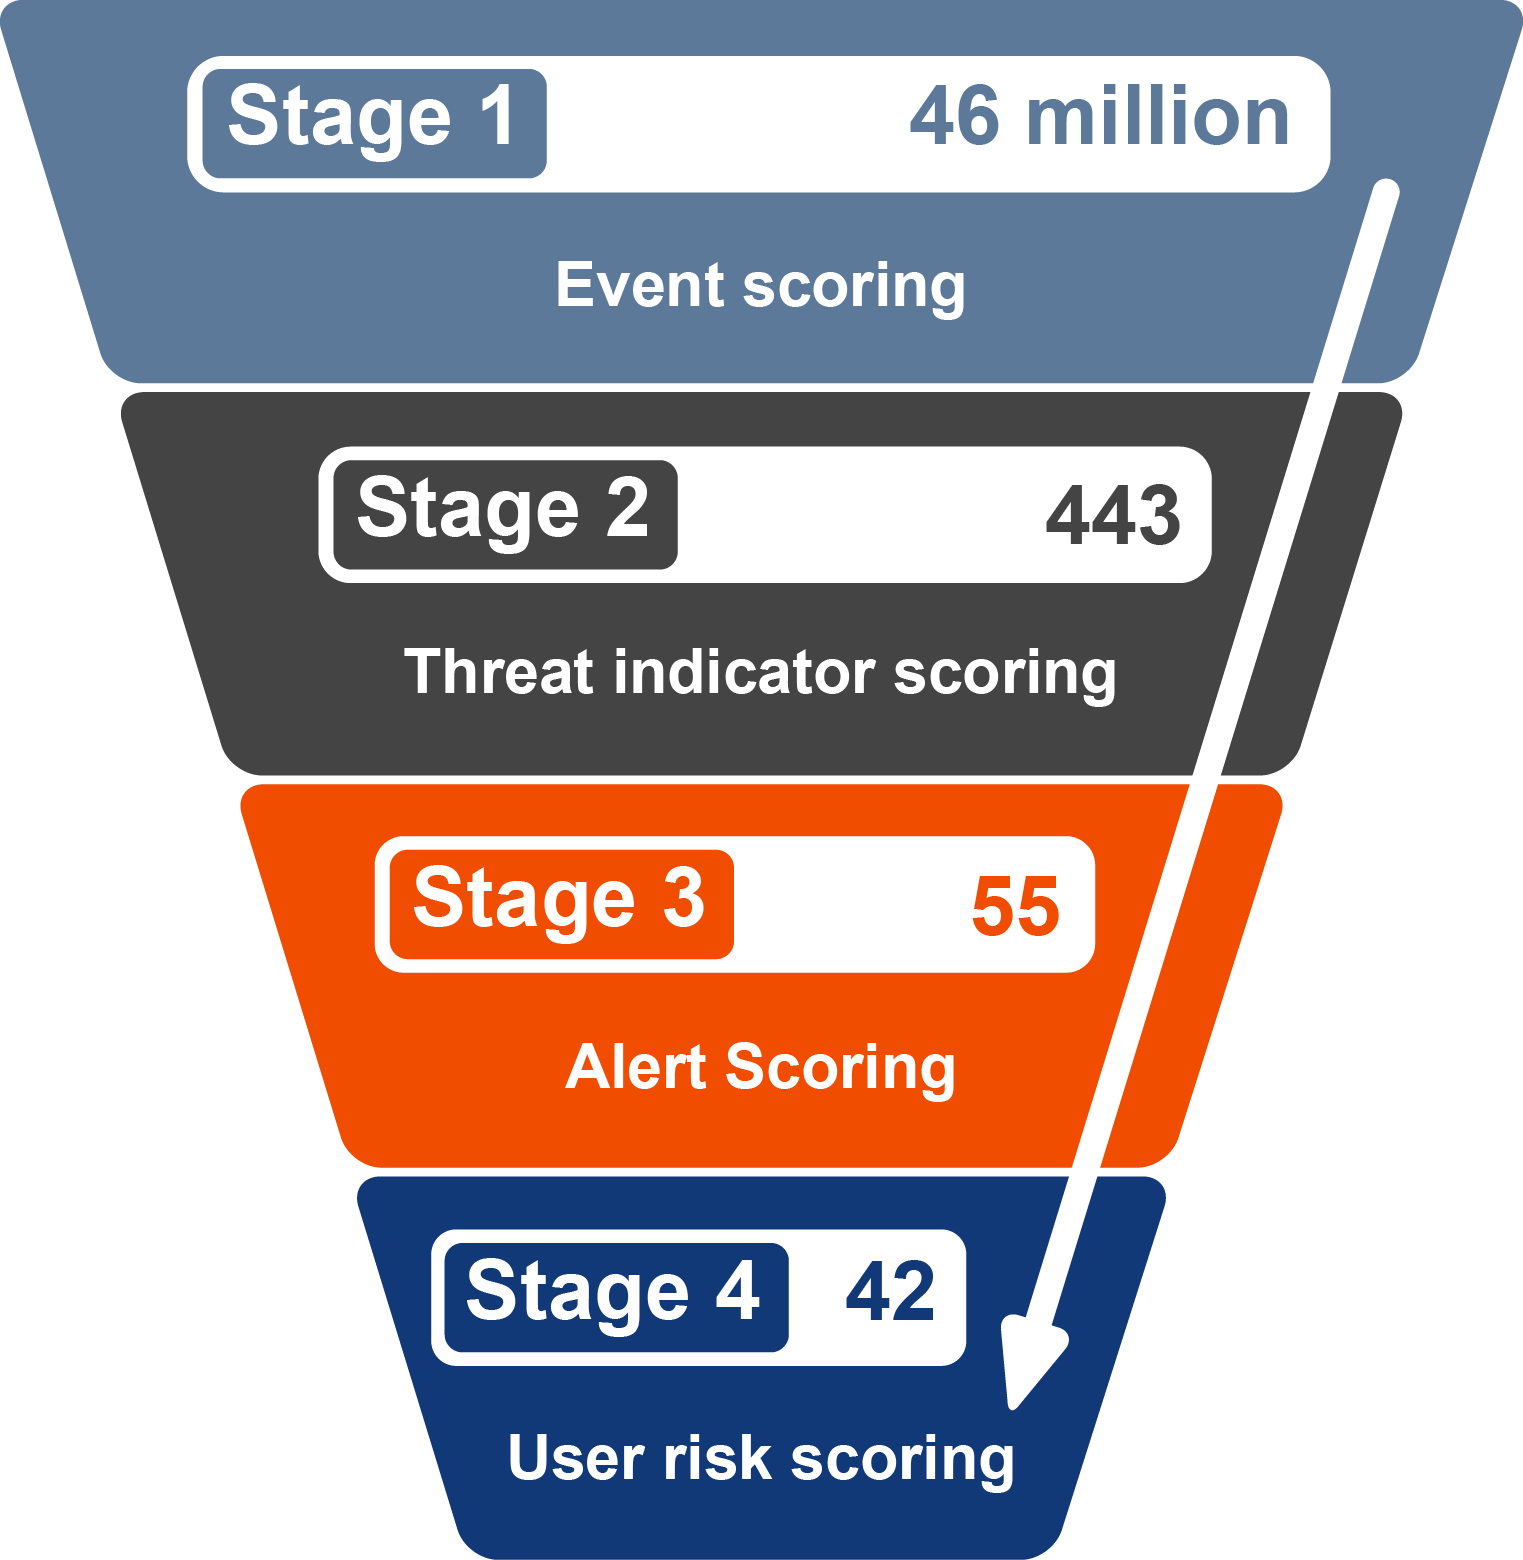
Risk scoring Each alert is assigned a risk score based on the criticality of its threat indicators. All the alerts that have been identified for each user are combined to produce an overall user risk score that reflects how risky or suspicious that user is. To ensure that only highly suspicious patterns of activity are highlighted and more innocuous alerts are suppressed, risk scoring is applied at four different stages. Table 1. Event scoring stages Stage Description Stage 1: Event scoring Each raw event is given an initial risk score that rates the abnormality of its parameters, such as the computer, time or file location. Stage 2: Threat indicator scoring Similar events are grouped as threat indicators and scored again to identify abnormal patterns that extend over a period of time, such as an hour. Stage 3: Alert scoring SMART alerts correlate events and threat indicators into an aggregate alert, which is scored for a third time based on the uniqueness of its composition and the severity of the activities involved. Indicators that are not scored high enough, or that are not correlated with other indicators in the same time period, are eliminated as false positives so that they do not create excessive noise. Only the SMART alerts that are scored as most critical are shown in the dashboard. The final score ranges between 0 and 100, where 0 reflects an event/session/user which is completely adequate with the normal baseline, whereas 100 indicates a very unusual anomaly. Stage 4: User risk scoring The user risk score is an aggregate of the contribution to user scores for each alert related to the user. The contribution to the user score value for the alert is dependent on the alert severity. Critical alerts contribute 20, high contribute 15, medium contribute 10, and low contribute 1. The users with the highest risk scores are highlighted in the Threat Detection dashboard. Figure 1. Event scoring stages
Each alert is assigned a risk score based on the criticality of its threat indicators. All the alerts that have been identified for each user are combined to produce an overall user risk score that reflects how risky or suspicious that user is. To ensure that only highly suspicious patterns of activity are highlighted and more innocuous alerts are suppressed, risk scoring is applied at four different stages.
Table 1. Event scoring stages
Stage
Description
Stage 1: Event scoring
Each raw event is given an initial risk score that rates the abnormality of its parameters, such as the computer, time or file location.
Stage 2: Threat indicator scoring
Similar events are grouped as threat indicators and scored again to identify abnormal patterns that extend over a period of time, such as an hour.
Stage 3: Alert scoring
SMART alerts correlate events and threat indicators into an aggregate alert, which is scored for a third time based on the uniqueness of its composition and the severity of the activities involved.
Indicators that are not scored high enough, or that are not correlated with other indicators in the same time period, are eliminated as false positives so that they do not create excessive noise. Only the SMART alerts that are scored as most critical are shown in the dashboard.
The final score ranges between 0 and 100, where 0 reflects an event/session/user which is completely adequate with the normal baseline, whereas 100 indicates a very unusual anomaly.
Stage 4: User risk scoring
The user risk score is an aggregate of the contribution to user scores for each alert related to the user. The contribution to the user score value for the alert is dependent on the alert severity. Critical alerts contribute 20, high contribute 15, medium contribute 10, and low contribute 1. The users with the highest risk scores are highlighted in the Threat Detection dashboard.
Figure 1. Event scoring stages
Threat Detection process Threat Detection process includes the following steps: 1 Events are sent to the Threat Detection server to be processed and analyzed. 2 Machine learning and user behavior analytics analyze user actions in the stream of events and builds a multi-dimensional baseline of typical behavior for each user in the environment. 3 Once the baselines are established, predefined threat indicators are used to detect anomalous user activity in real time. 4 SMART technology provides prioritized alerts that reflect a meaningful deviation in user behavior. 5 A risk score is assigned to each alert to identify the level of threat they pose to your environment. 6 A risk score is assigned to each user. This score is a sum of the total alert points assigned to the user using the "contribution to user score'" points associated with each alert. Users with the highest user risk scores are highlighted in the Threat Detection dashboard, creating a dynamic watch list of emerging risky user threats sorted by severity.
Threat Detection process includes the following steps:
Using the Threat Detection Dashboard • Deployment and installation • Accessing the dashboard • Overview tab • Users tab • Alerts Tab • How to perform an alert investigation • Common functions
계열사 지원 사이트에서 Quest *제품*에 대한 온라인 지원 도움말을 볼 수 있습니다. 올바른 *제품* 지원 콘텐츠 및 지원에 연결하려면 계속을 클릭하십시오.
The document was helpful.
평가 결과 선택
I easily found the information I needed.
Quest Software 포털은 더 이상 IE 8, 9, 10을 지원하지 않습니다. 브라우저를 최신 버전의 Internet Explorer나 Chrome으로 업그레이드하는 것이 좋습니다.
IE 11로 업그레이드 여기를 클릭
Chrome으로 업그레이드 여기를 클릭
IE 8, 9 또는 10을 계속 사용할 경우 당사가 제공하는 뛰어난 셀프서비스 기능 모두를 최대한으로 활용하실 수 없습니다.