Using setuid_launcher to configure secure launcher permissions
This section contains instructions for using setuid_launcher to give agents elevated permissions.
|
1 |
|
3 |
Set the path to point to the setuid_launcher executable. This executable is located in <fglam_home>/bin/setuid_launcher. |
|
4 |
|
5 |
|
6 |
Change the owner of <fglam_home>/bin/setuid_launcher to root. This permits the agents that need root privileges to be run as the root user without requiring a password. |
If these permissions are no longer needed, issue the following command:
chmod u-s <fglam_home>/bin/setuid_launcher
|
1 |
Navigate to <fglam_home>/state/default/config. |
|
2 |
Open the fglam.config.xml file for editing. |
|
3 |
Edit the <config:path> element under <config:secure-launcher> to point to your local setuid_launcher executable. This executable is located in <fglam_home>/bin/setuid_launcher. |
|
4 |
|
5 |
Change the owner of <fglam_home>/bin/setuid_launcher to root. This permits the agents that need root privileges to be run as the root user without requiring a password. |
Preventing Agent Manager core dumps on Linux
Installing and running the Agent Manager on a Linux® machine with several interfaces can result in a core dump with the following console output:
This error is related to a known JavaTM 6 issue, JDK-7078386. This issue is resolved in Java 7. For more information about JDK-7078386, you can visit http://bugs.java.com/bugdatabase/view_bug.do?bug_id=7078386.
|
2 |
On this machine, install the Agent Manager, and navigate to the following directory: <fglam_home>/state/default/config. |
|
3 |
In this directory, locate and open the vm.config file for editing. |
|
4 |
In the vm.config file, search for the java.vm property, and edit its value to point to the new JDK 7 installation. |
|
5 |
Save your changes to the vm.config file, and close it. |
Monitoring the Agent Manager performance
Foglight® uses the Agent Manager to communicate with monitored hosts. The embedded Agent Manager can be used to monitor the host on which the Management Server is installed. Your monitoring environment typically includes a number of Agent Manager instances installed on different hosts.
Investigating Agent Manager diagnostics
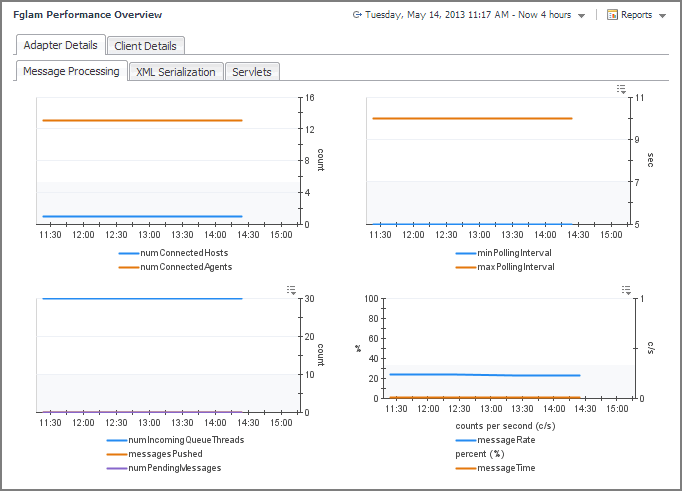
You monitor the state of your Agent Manager instances and the related Management Server adapters using the FglAM Performance Overview dashboard. Use this dashboard to better find out how these components perform over time and to look for any indicators that may predict potential bottlenecks. For example, an unusually high number of pending messages in the queue indicates a potential performance bottleneck. To access this dashboard, from the navigation panel, choose Dashboards > Management Server > Diagnostic > Agent Manager.
The information appearing on this dashboard appears on two major tabs, Adapter Details and Client Details, each consisting of several sub-tabs. For more information about the data appearing on this tab, see the following topics:

