Creating Dashboards for Monitoring Statistics within Your SharePoint Farm
The ControlPoint Configuration site contains the following custom lists that ControlPoint Application Administrators can use to create "dashboards" of Web Parts for monitoring statistics within a SharePoint farm:
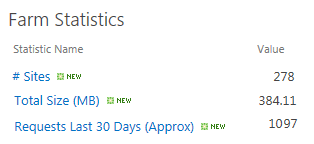
·Farm Statistics - Individual farm-wide metrics that are typically presented individually.
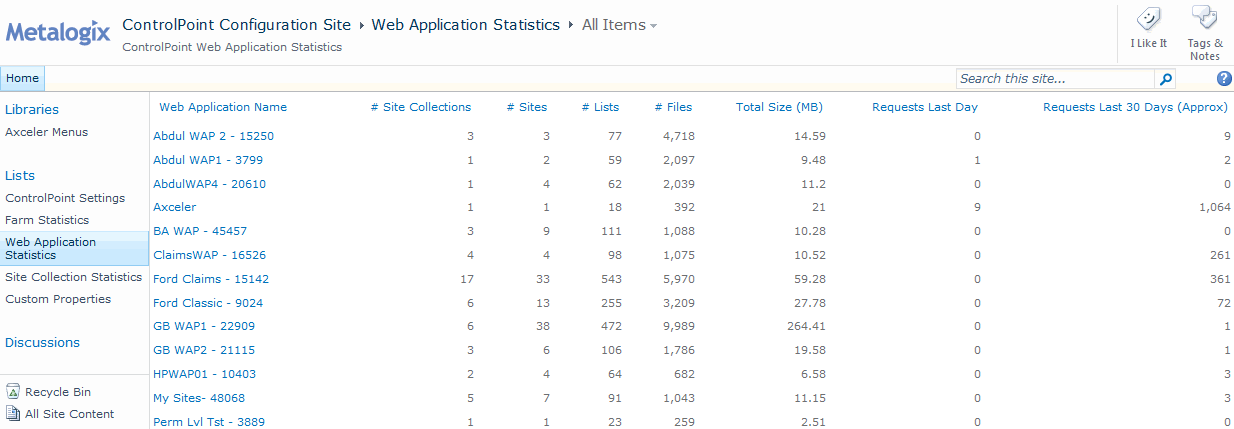
·Web Application Statistics - Rows of data about each Web application. Depending on your needs, you can present aggregate data (column sums, maximums, standard deviation, and so on).
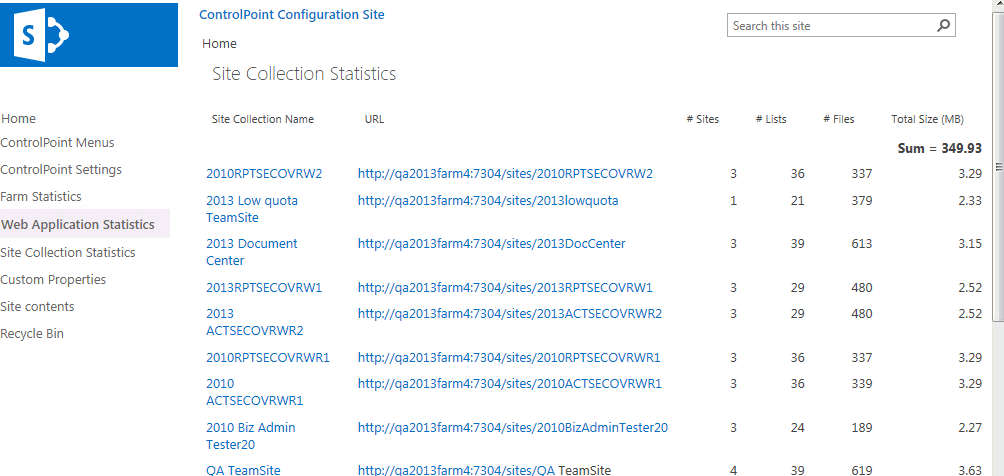
·Site Collection Statistics - Rows of data about each site collection which, like Web Application Statistics, can be customized to present aggregate data as well as key performance indicators (KPIs).
NOTE: by default, the Site Collections Statistics list includes all site collections in the farm. ControlPoint Application Administrators can, however, eliminate from the list groups of site collections that they do not want to monitor by excluding the Web applications that host them as described in the ControlPoint Administration Guide. This may be useful, for example, if the number of site collections in your farm exceeds the SharePoint recommended maximum number of list items.
How Statistics Lists are Populated
Statistics lists are populated as part of the ControlPoint Discovery job. When this job runs, the lists are cleared and re-populated with current data.
NOTE: Because of the way in which they are populated, if any of these lists are copied or moved, statistics data will become static (that is, it will not be updated) in the new location.
To create a statistics dashboard on the ControlPoint Configuration root site main page:
NOTE: The steps below are intended to provide introductory guidelines for creating dashboards on the ControlPoint Configuration root site main page. Consult your SharePoint documentation and other available resources for more detailed instructions and/or guidance in using alternate tools and techniques.
1From the ControlPoint Configuration site main page, choose Site Actions > Edit Page.
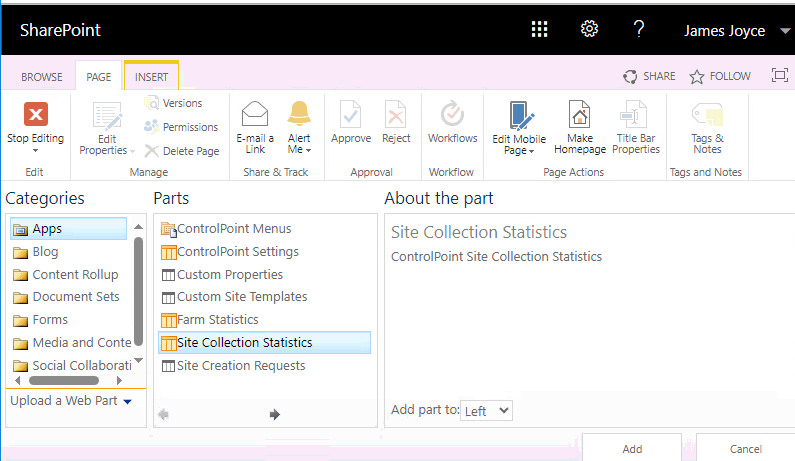
2Click Add a Web Part, then choose the list(s) that you want to add as Web Parts to that area of the page.
EXCEPTION: The Web Statistics KPI List is configured and added to the page using a different method. See "To configure the Web Statistics KPI, " following.
You can either use the default view that has been defined for the list or create a custom view.
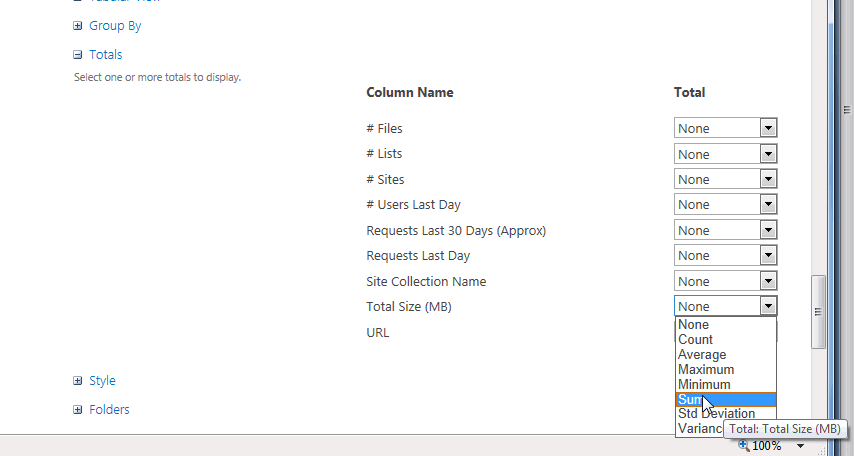
You can, for example, change the display order of columns; display a subset of columns; display columns that are not included in the default view; add a calculated column; display column totals.
·Example: Site Collection Statistics with calculated columns to track size and storage utilization.
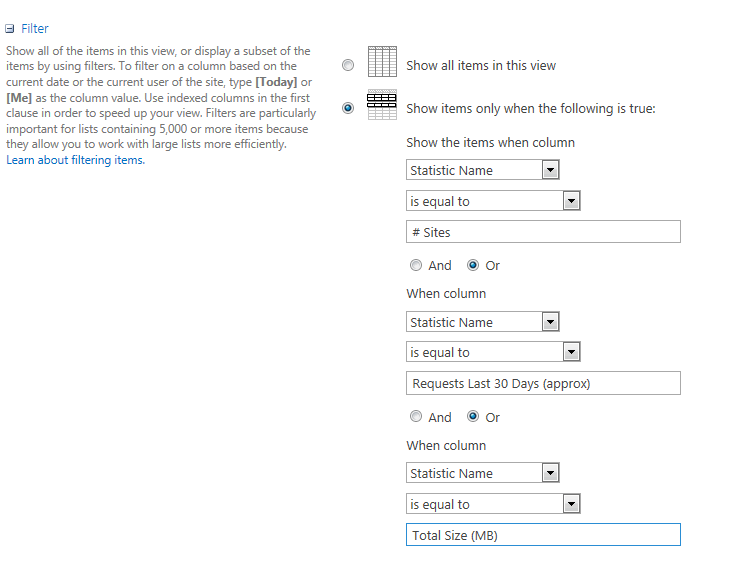
·Example: Farm Statistics filtered to show only "high priority" metrics.
The GDPR Dashboard
If your organization is subject to General Data Protection Regulation (GDPR) compliance, the GDPR dashboard provides an overview of how your organization is using ControlPoint to manage regulation-sensitive areas of your SharePoint environment.
GDPR dashboard statistics are populated based on usage of the following functionality:
·SharePoint Audit Settings
To access the GDPR dashboard:
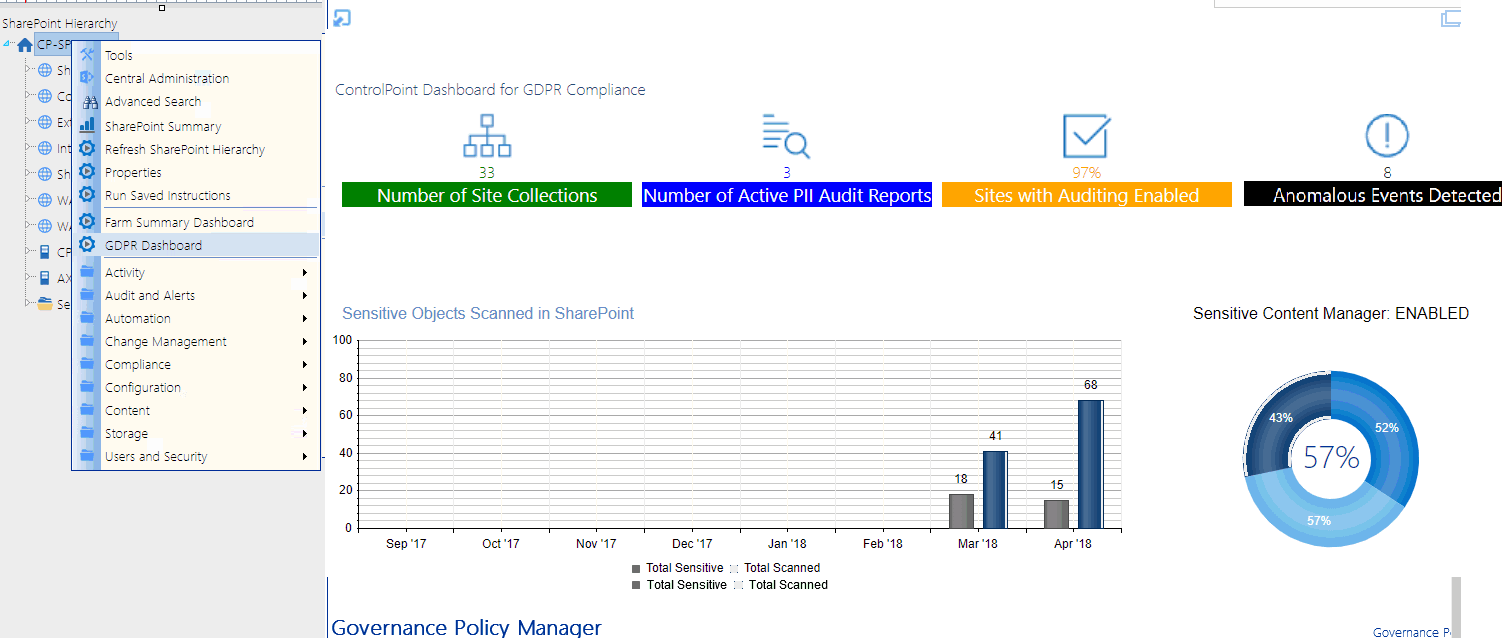
From SharePoint Hierarchy farm node, choose GDPR Dashboard.
The GDPR Dashboard displays the following information:
·the Number of Site Collections in your farm (excluding Central Administration) as of the last ControlPoint Discovery run.
·If your organization uses Sensitive Content Manager:
§Number of Active PII Audit Reports represents the number of Sensitive Content Manager jobs scheduled to be scanned and ControlPoint policies created to scan documents.
§Sensitive Objects Scanned in SharePoint shows the number of documents determined to contain sensitive content compared to all items scanned within a given month.
§the Sensitive Content Manager: ENABLED donut graph shows the following percentages:
oThe light blue section represents the percentage of site collections containing content for which at least one scan has been performed PLUS site collections that have at least one Active PII Audit Report.
NOTE: This percentage is also the number that displays inside the donut graph.
oThe medium blue section represents the percentage of site collections containing content for which at least one scan has been performed.
othe dark blue section represents site collections that have had no Sensitive Content Manager activity.
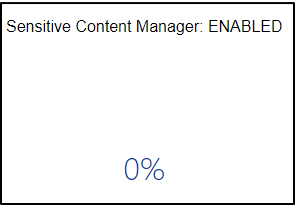
If you have never used Sensitive Content Manager, this section will always display 0%.
·If your organization uses ControlPoint Sentinel, Anomalous Events Detected represents the number of deviations in document views and downloads from individual users' "typical" daily usage patterns
·Sites with Auditing Enabled represents the percentage of site collections within your SharePoint farm for which all audit settings are enabled.
NOTE: If any of the site collection audit settings are not enabled or if audit settings are enabled at the site level or below (which is possible if you are using ControlPoint Manage Audit Settings functionality), the site collection will not be counted in this percentage.
·If your organization uses ControlPoint Governance Policy Manager, the bottom section lists all of the Governance Policies that currently exist for the farm.

Setting Object Properties
You can use ControlPoint to set properties for site collections, sites, and lists.
In a multi-farm environment, properties can be set across multiple farms; the user interface for the home farm is always used. Therefore, if your multi-farm installation includes different SharePoint versions (for example, both 2016 and 2019) or variations (for example, ControlPoint Standard and ControlPoint Online), which necessitates differences in the user interface, some options may be missingor not validfor the remote farm.-
Setting Site Collection Properties
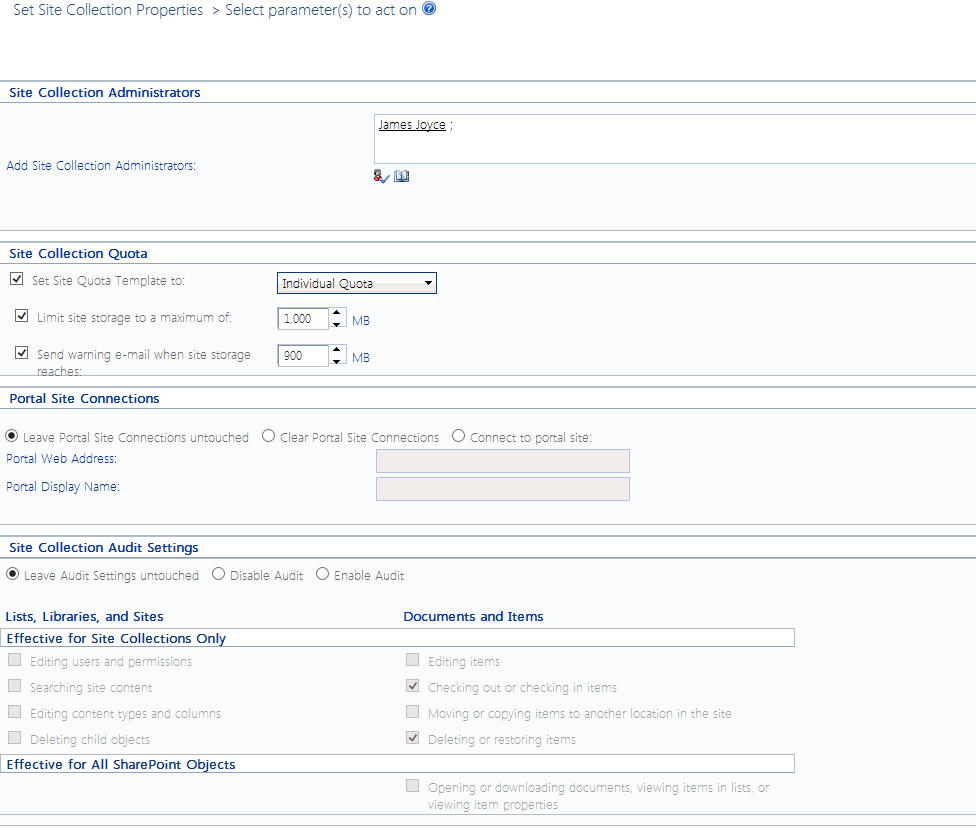
Set Site Collection Properties is a ControlPoint action that lets you set the following properties for one or more site collections within a SharePoint farm:
·Site Collection Administrators
·Site Collection Quota
·Portal Site Connections
·Site Collection Audit Settings
·Site Collection Search Settings
·SharePoint Designer Settings (SharePoint Server)
·Audit Log TrimmingTo set site collection properties:
1Select the site collection(s) for which you want to set properties.
2Choose Configuration > Set Site Collection Properties.
3In the Parameters section, specify each property you want to set as you would if you were performing Site Collection Administration via SharePoint Site Settings.
EXCEPTION: Set Site Collection Audit Settings as you would if you were using the ControlPoint Manage Audit Settings action.
NOTE: Changes to SharePoint Designer Settings will impact only users who are not Site Collection Administrators. SharePoint maintains SharePoint Designer Settings for Site Collection Administrators at the Web application (not Site Collection) level.
Now you can:
·run the operation immediately (by clicking the [Run Now] button)
OR
·complete the Enforce Policy section and schedule the operation to run at a later time.
OR
·save the operation as XML Instructions that can be run at a later time.
If you chose the Run Now, option, after the operation has been processed:
·a confirmation message displays at the top of the page, and
·a ControlPoint Task Audit is generated for the operation and displays in the Results section.
If you schedule the operation, a link to the Task Audit is included in the scheduled action notification email.
See also The ControlPoint Task Audit.


