Table 8. Top 5 Most Consumed Response Time view
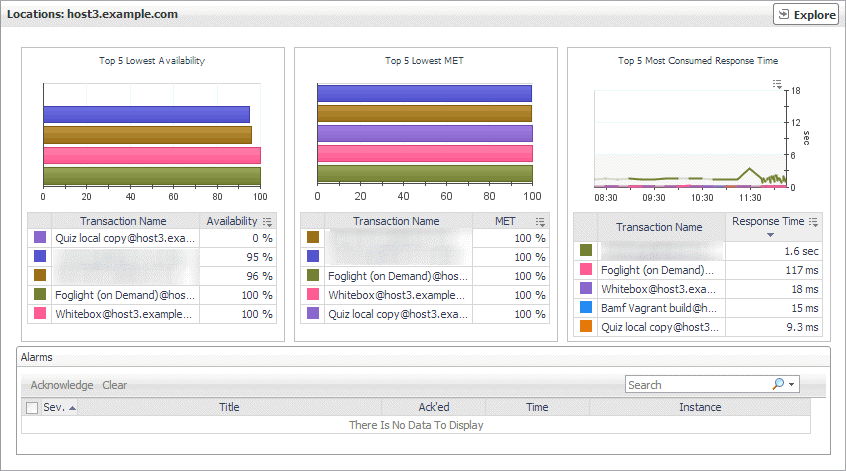
The Location view displays overall response and availability information for the transactions monitored from the selected location. It also identifies the transactions with the lowest availability, lowest MET (met expected time), and highest response time, showing the top five transactions in each of these categories. Use this view to identify the Web sites with degraded performance, and to perform further investigation.
The Location view appears on the right.
This view is made up of the following embedded views:
Locations view
The Locations view lists the hosts that are running instances of the Web Monitor Agent, and shows their states.
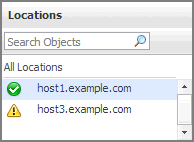
Selecting All Locations shows a list of all host names in the Summary - All Locations view on the right. Similarly, selecting a location in the list shows location-specific metrics in the Location view view on the right.
|
|
|
• |
Alarm severity. The state of the most recent alarm raised against the associated location: Warning  , Critical  , or Fatal  . |
|
• |
All Locations. A parent node for the location object instances that appear in this view. |
|
• |
Location. The name of the host on which the Web Monitor Agent is running. | |
|
|
Drill down on:
|
Table 9. Locations view
The Locations view lists the hosts that are running instances of the Web Monitor Agent, and shows their states.
Selecting All Locations shows a list of all host names in the Summary - All Locations view on the right. Similarly, selecting a location in the list shows location-specific metrics in the Location view view on the right.
|
|
|
• |
Alarm severity. The state of the most recent alarm raised against the associated location: Warning , Critical , or Fatal . |
|
• |
All Locations. A parent node for the location object instances that appear in this view. |
|
• |
Location. The name of the host on which the Web Monitor Agent is running. | |
|
|
Drill down on:
|
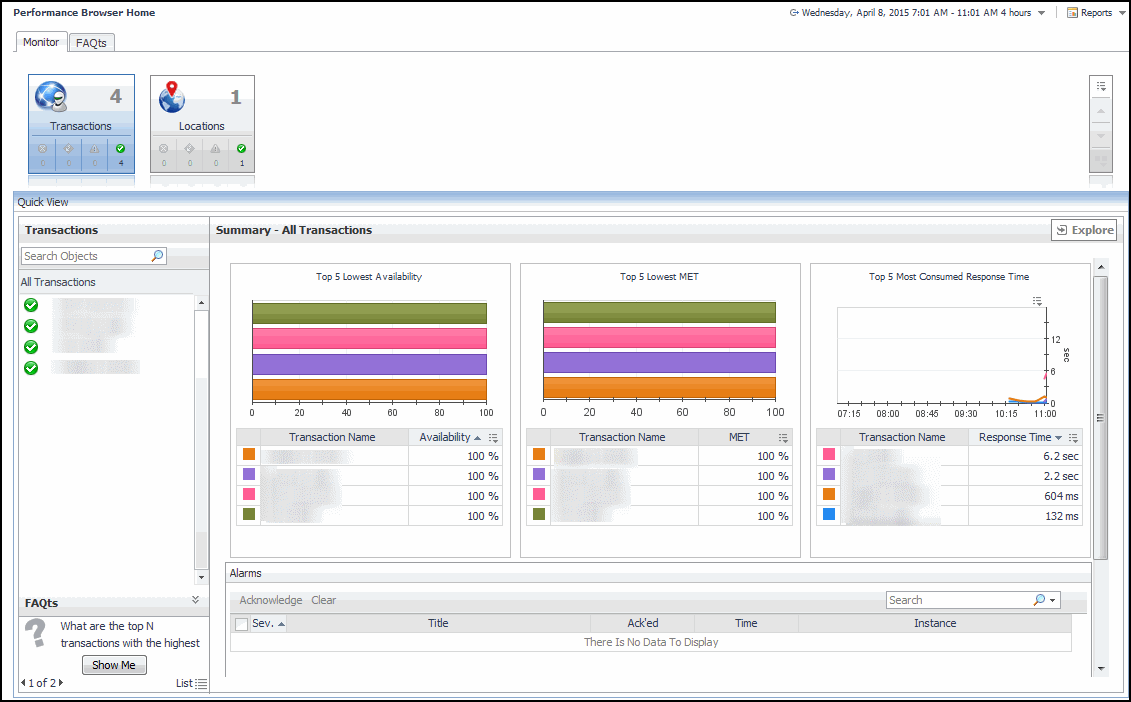
Monitor tab
The Monitor tab is a container view. It displays a combination of location or transaction information, depending on your selection in the Web Monitor Environment view and the Quick View. Use it to understand the level of user experience offered by the monitored Web sites, and to investigate any issues that they may be experiencing.
The Monitor tab appears open.
This view is made up of the following views: