Use the Data Report Designer to design reports visually. Stored in .tdr files, data reports are "live" reports that can be refreshed dynamically. What makes them dynamic is that they contain the underlying queries for report data sets. Each time a data report is opened, its query runs and the latest data is retrieved. The dynamic nature of data reports makes them ideal for distribution to users who need to see changes to data without waiting for scheduled updates or for new reports to be distributed.
The process of creating a data report has the following steps:
Note: This procedure does not cover all of the possible steps of creating a data report. It only covers the steps required to create a report for the scenario.
|
Scenario Your company wants to improve its global sales, starting with countries where it has a customer base but averages low sales. You created a query that displays countries with less than $500,000 in sales per fiscal year, but now you need to create a report to help represent and evaluate the results. The data should be grouped per country and show the total and average sales for each country. In addition, you want the report to look similar to the rest of the company's documents, which use specific colors and fonts. Note: This scenario uses the data generated in Visually Build a Query. |
The Toad Data Report wizard creates an initial layout of the report based on options you select, including what columns to include, whether to group data, and the basic style.
To run the wizard
 to include all columns in the report and click Next.
Select COUNTRY_NAME and click 
Tip: You can create a secondary group by selecting another column and clicking 
Select Outline 1 and click Next.
Tip: The Outline and Align Left options are good choices if you grouped the data.
You can move, rename, and update the category of a field.
To update the fields
Click 
 by the Format String field.
|
Field |
Band |
Name |
|---|---|---|
| FISCAL YEAR | groupHeaderBand2 | Fiscal Year |
| SUM(SALES.AMOUNT_SOLD) | groupHeaderBand2 | Sales Amount |
| Avg | groupFooterBand1 | Average |
Right-click the COUNTRY NAME field (not the COUNTRY_NAME field on the right) in groupHeaderBand1 and select Delete.
Note: The COUNTRY NAME field is a label that precedes the COUNTRY_NAME field value. If you preview the report before you delete the COUNTRY NAME field, the country displays as 'COUNTRY NAME Argentina'. It is clear that Argentina is the country name, so this field is redundant.
The Data Report Designer uses styles to format different objects and kinds of data. Once you define a style, you can apply it to similar fields to create a consistent and easy-to-update design.
To create, update, and apply styles
 . The Styles Editor window displays.
Select the Foreground Color field, and then select MidnightBlue in the Web tab.
Note: All colors in this scenario are from the Web tab.
 . The Font window displays.
 four times in the Styles Editor window to create four new styles.
Set the following properties for the new styles:
|
First Style |
Properties |
|
Name |
OddRow |
|
Background Color |
WhiteSmoke |
|
Border Color |
MidnightBlue |
|
Borders |
Bottom |
|
Font |
Tahoma, 10pt |
|
Second Style |
Properties |
|
Name |
EvenRow |
|
Border Color |
MidnightBlue |
|
Borders |
Bottom |
|
Font |
Tahoma, 10pt |
|
Third Style |
Properties |
|
Name |
TableHeading |
|
Background Color |
MidnightBlue |
|
Font |
Tahoma, 10pt, bold |
|
Foreground Color |
White |
|
Fourth Style |
Properties |
|
Name |
CountryName |
|
Font |
Tahoma, 14pt, bold |
|
Foreground Color |
Black |
Select TableHeading in the Style field (under Styles) for the Fiscal Year and Sales Amount fields in groupHeaderBand2.
|
Field |
Property |
|---|---|
| Even Style | EvenRow |
| Odd Style | OddRow |
Bands group the information layout in the report and you can add controls to include additional tables, images, fields, and other items in the report.
Select the groupHeaderBand1 and move it down half an inch.
Tip: It is helpful to expand a band before adding controls to give you plenty of room in which to work.
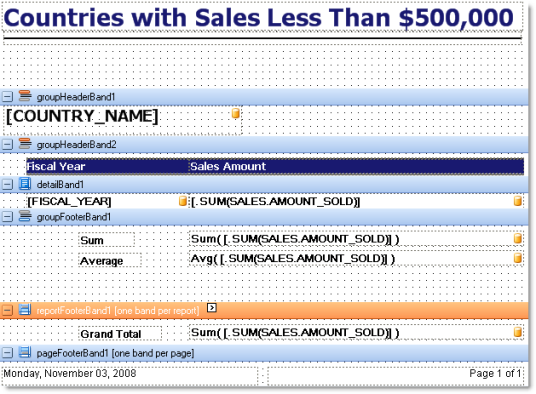
 Click here to see the Data Report Designer layout.
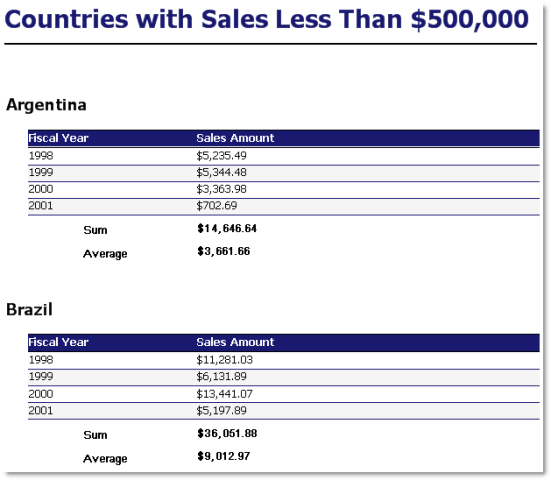
 Click here to see the report preview.