Identifying top Application consumers
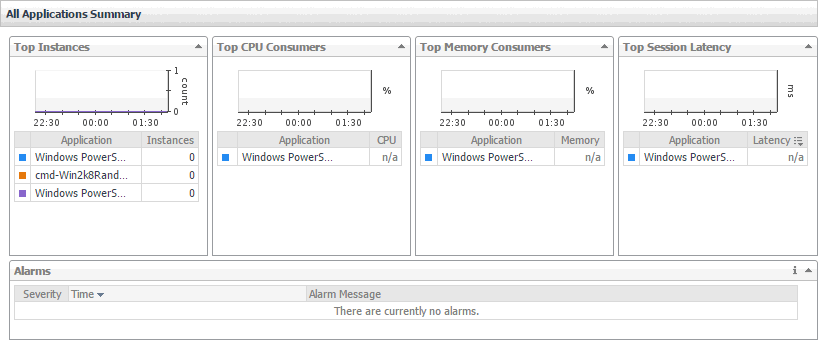
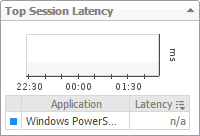
Your monitored XenDesktop environment delivers applications to end users on demand. The All Applications Summary view identifies the applications with the highest number of instances, and the highest CPU and memory utilization, and session latency. This view appears in the Quick View when you select All Applications in the Applications view on the left. Use it to look for potential bottlenecks in your system and prevent potential service disruptions by reallocating system resources where they are most needed.
Investigating Application details
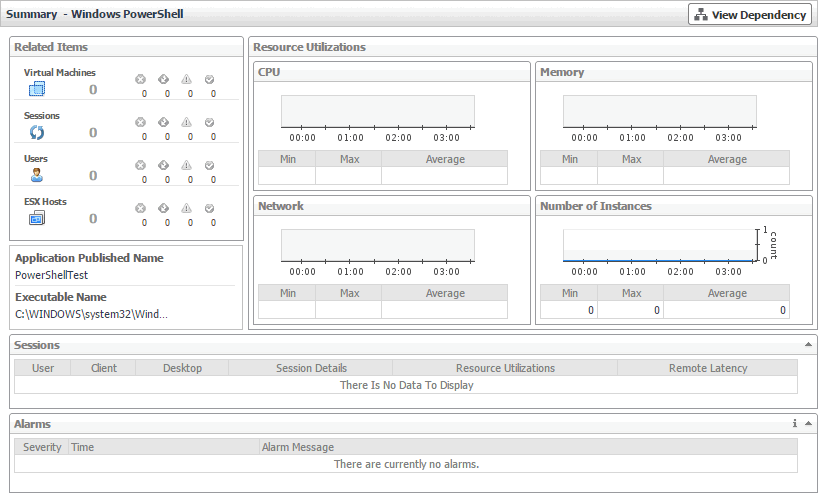
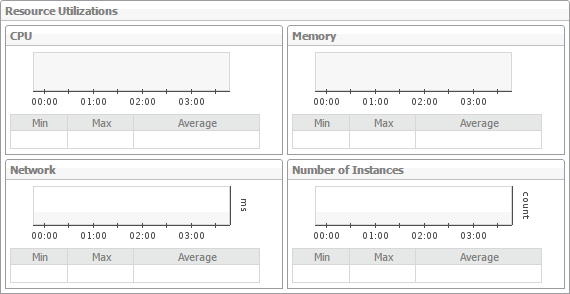
In your monitored environment, applications are delivered to end users on demand. You can review how individual applications are distributed to end users in the Summary - Application view. This view shows the usage of system resources for the selected Application. Use it to see the number of users that are using it, and to look more closely a individual application instances. A high number of users, for example, can lead to performance degradation, and should be investigated.
|
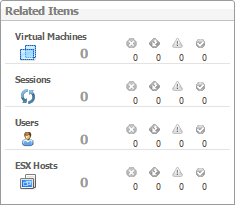
The objects that are associated with the selected application and their alarm state. | |
Monitoring Sessions
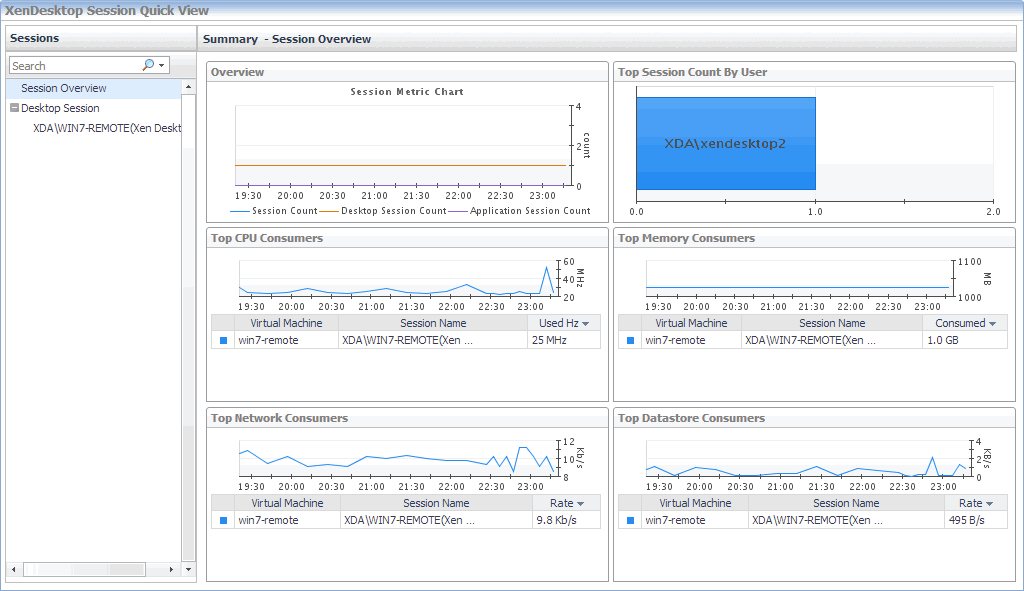
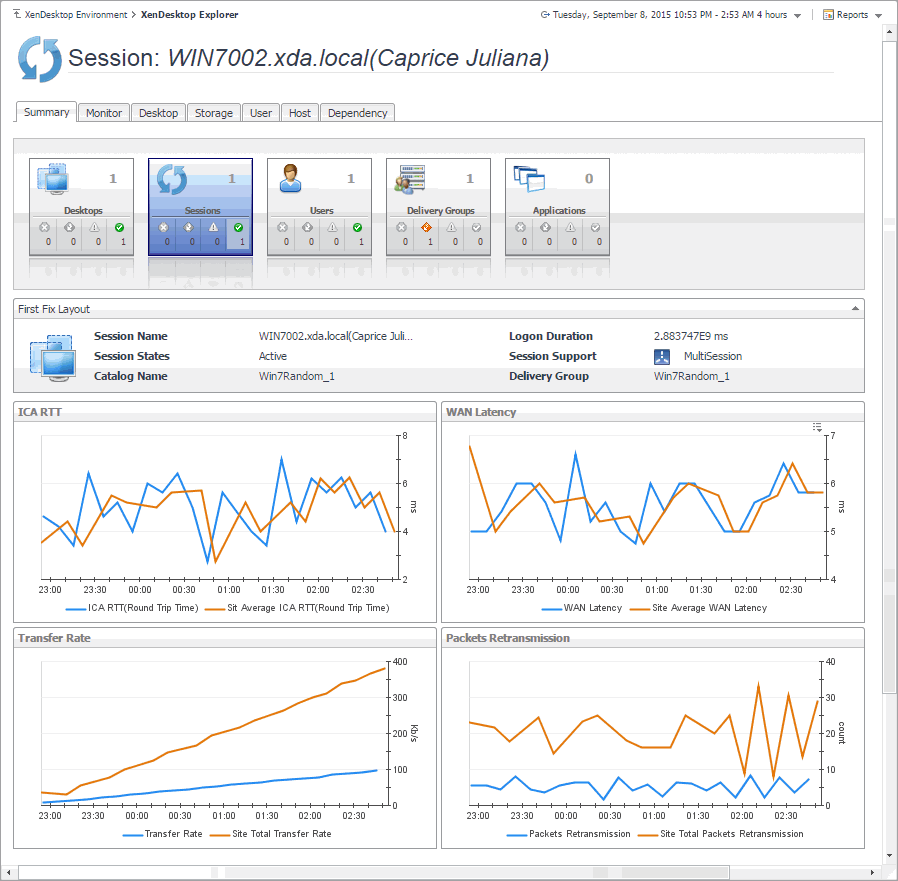
When an end user obtains access to a virtual desktop, this results in a desktop session. A session is a specific instance of an end user’s activity. For those desktops that are monitored by NetScaler agents, you can monitor their sessions. To do that, select the Sessions tile on the XenDesktop Environment dashboard. The information appearing in the XenDesktop Session Quick View can help you discover potential resource-level issues such as high session counts, and to reallocate resources where they are most needed.
|
1 |
|
2 |
|
3 |
|
4 |
|
• |
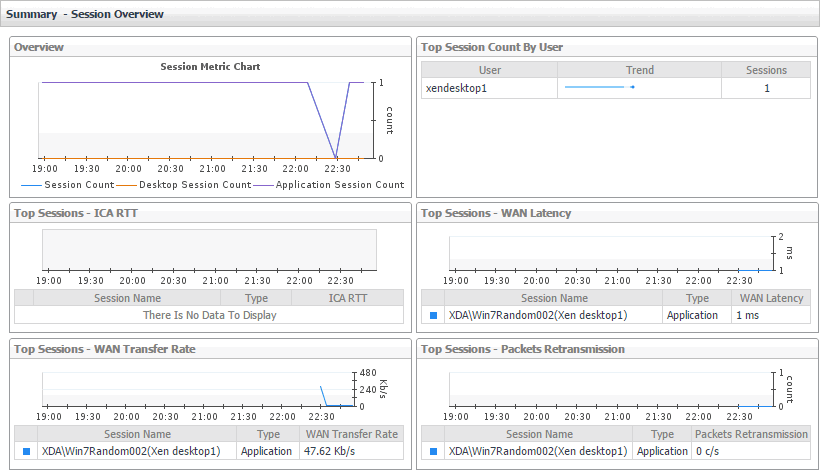
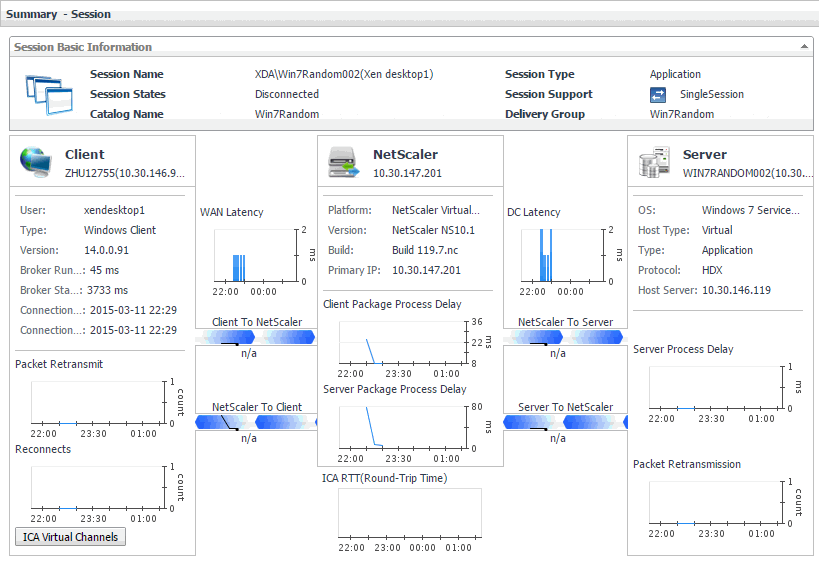
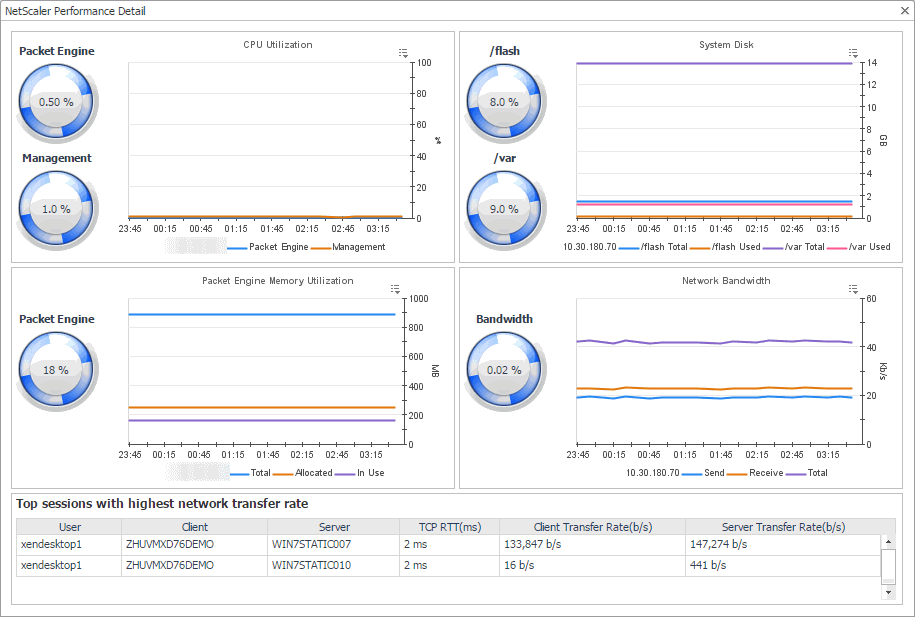
If NetScaler data is available, the following information appears on the Summary - Session view. |
|
• |
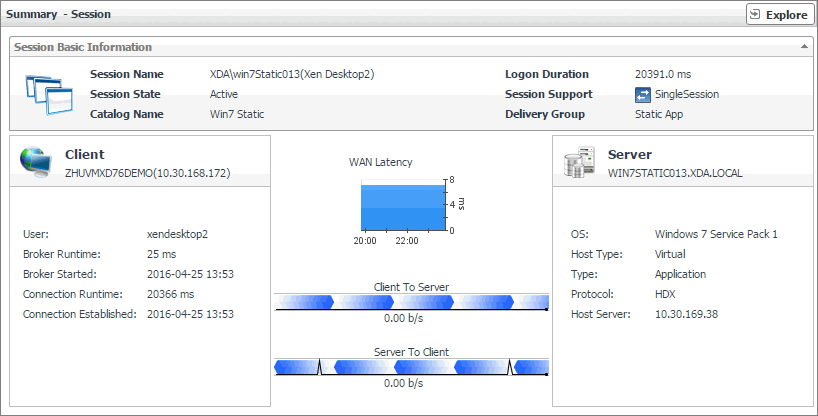
If NetScaler data is not available, the following information appears on the Summary - Session view. |
|
5 |
|
TIP: You can also explore session details by choosing XenDesktop > XenDesktop Explorer, and then selecting a desired session in the XD Explorer tree on the navigation panel. |
Observing the Session Overview
A session is a specific instance of an end user’s activity with a virtual desktop. You can view the performance of desktop or application sessions when you create and configure NetScaler agents to collect ICA (Independent Computing Architecture) session information from monitored Citrix® NetScaler® gateways using Citrix® AppFlow®. For more information about XenDesktop Session agents, see Creating NetScaler Agent instances .
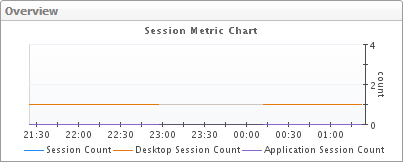
To get a good understanding of which desktops or applications consume the highest amounts of system resources, use the Summary - Session Overview view. For example, high peaks in the Session Metric Chart can indicate a sudden increase in the end-users’ activity that may result in compromised performance. This view can help you discover potential resource bottlenecks, and to reallocate resources where they are most needed.

