Servlets tab
The Servlets tab displays graphs that indicate the rates of read, write and request rates for the individual Adapter servlets: transfer, installer, and servlet, over the selected time range. It also shows the percentage of time the adapter spends on the requests coming from these components.
Exploring the Client Details tab
The Client Details tab allows you to investigate the performance of the Agent manager clients adapters that are connected to the FglAM Adapter. Use it to see their overall performance rates and to investigate any potential bottlenecks.
For more information about the data appearing on this tab, see the following topics:
Agent Manager Clients view
This view, accessible by clicking Expand to Select More Foglight Agent Manager Clients at the top of the Client Details tab, shows a list of the connected Agent Manager instances. For each Agent Manager instance, it shows the instance name, the numbers of pending messages and incoming queue threads, the upstream time difference, the number of disconnections, and the amounts of used physical and swap memory.
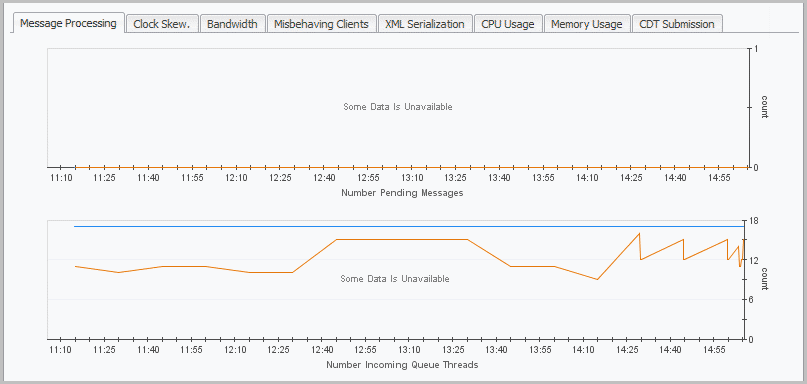
Message Processing tab
The Message Processing tab shows tables for the number of pending messages and the number of incoming queue threads for a selected Agent Manager instance.


