The Summary (All Virtual Machines) tab shows a summary of system resources for all virtual machines that currently exist in the selected Virtual Center.
|
2 |
This view is made up of the following embedded views:
|
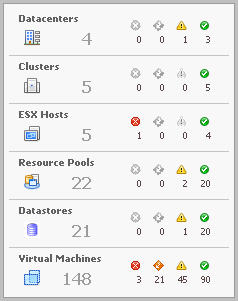
This embedded view shows the same information as the Virtual Environment view appearing on the Summary (All Clusters) tab. See page 143 for complete information. |
|
This tabular view lists all virtual machines that exist in the selected Virtual Center. | |||
| |||
| |||
| |||
| |||
| |||
| |||
|
Drill down on any virtual machine entry. The VMware Environment dashboard appears, showing the server details on the Summary tab. |
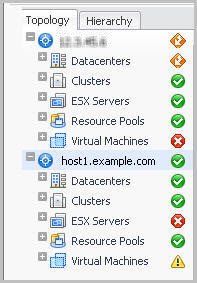
The Virtual Infrastructure view is made up of the following embedded views:
The top-level objects in the Topology view are always the VirtualCenters.
|
|
||
|
|
||
|
|
||
|
|
||
|
|
||
|
|
||
|
|
Each object in the Hierarchy view has a representative icon that is displayed at the left of the object’s name. These icons are shown in the table in Topology Tab .
The VMware Explorer dashboard has a Primary view that takes up the entire display area of the Foglight for VMware browser interface. For more information about the VMware Explorer dashboard, see Investigating performance metrics .
|
• |
|
• |
|
2 |
On the Virtual Infrastructure view, that appears on the navigation panel, select any node, except an individual virtual machine node. |