Getting Started with the Dependency Map
To access this dashboard, under Dashboards, choose vCloud Director > vCloud Dependency.
Navigating the Object Hierarchy
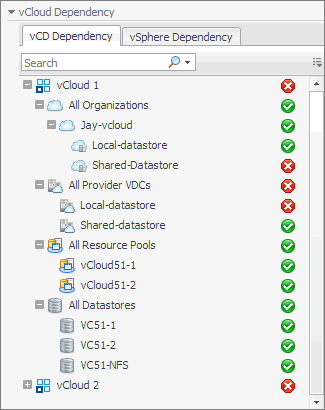
The vCloud Dependency view appearing on the navigation tab shows a navigation tree representing a simplified map of your monitored objects, and pertinent alarm information.
On the right of each object in the vCloud Dependency view status indicators are displayed. Each status indicator represents the alarm of the highest severity that is generated against the object. For an object type container, the status indicator represents the alarm of highest severity that is outstanding for all objects of that type.
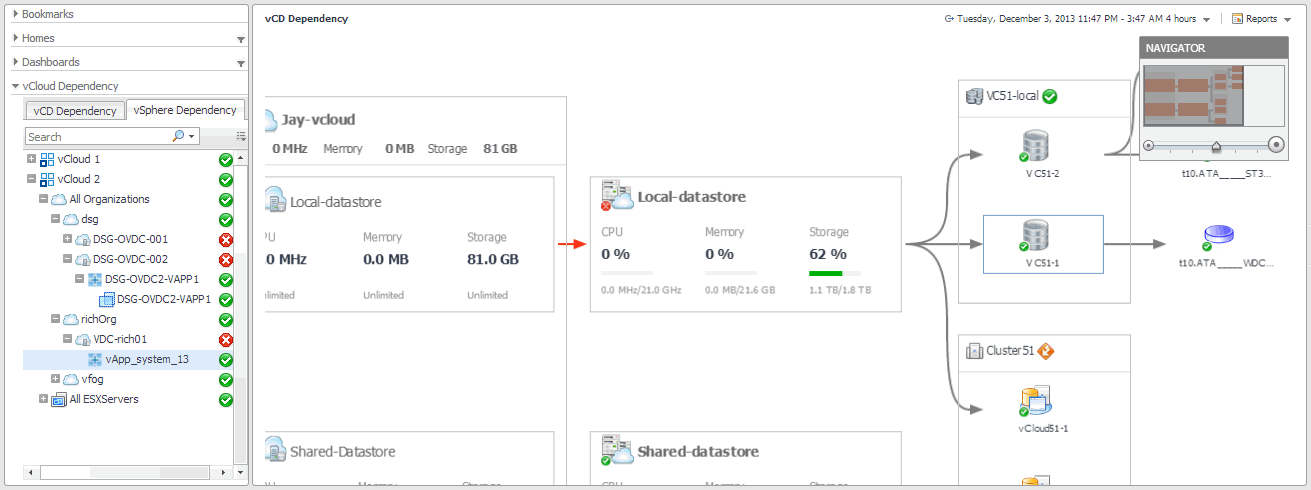
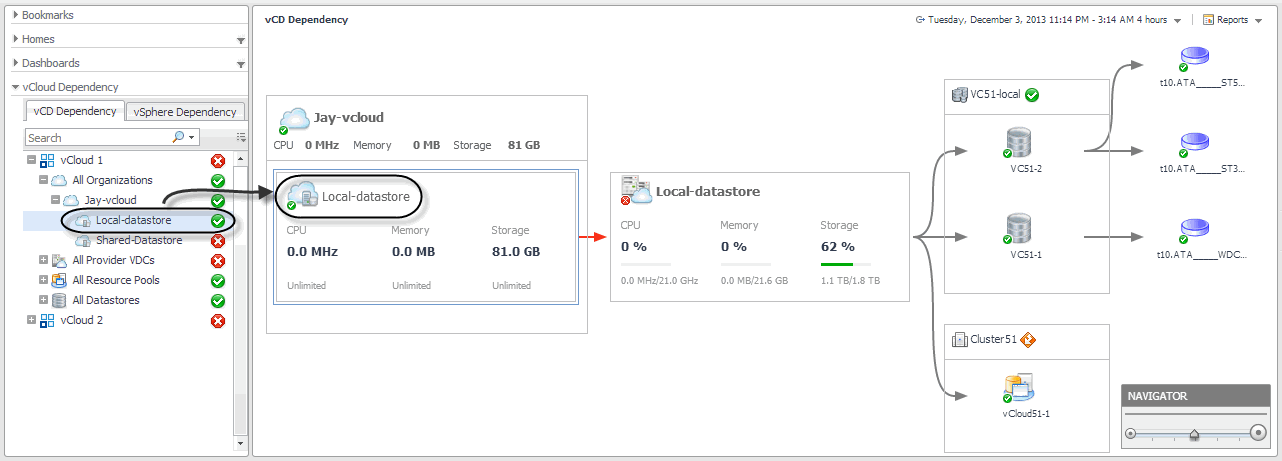
When you select an object from the vCloud Dependency view, the vCloud Logic Dependency dashboard displays a dependency map showing the selected object and any dependencies that it may have with other physical and virtual components in your monitored environment.
The information appearing in this view is organized into two tabs:
vCD Dependency tab
The vCD Dependency tab illustrates the logical dependencies between the monitored objects. To open this tab, on the navigation panel, under vCloud Dependency, click vCD Dependency.
vSphere Dependency tab
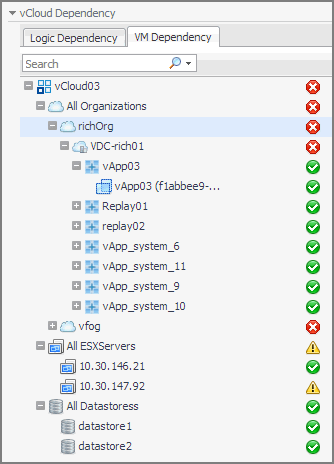
The vSphere Dependency tab focuses on the relationships between organizations and virtual machines. To open this tab, on the navigation panel, under vCloud Dependency, click vSphere Dependency.
Like the vCD Dependency tab, this tab also displays the monitored vCloud Director® as the root of the navigation tree, with organizations, ESX hosts, and datastores immediately below. The tree also displays virtual machines organized into vApps. Use this view to quickly find any of these components and investigate their effect on the performance of virtual machines in your environment.


