|
3 |
|
4 |
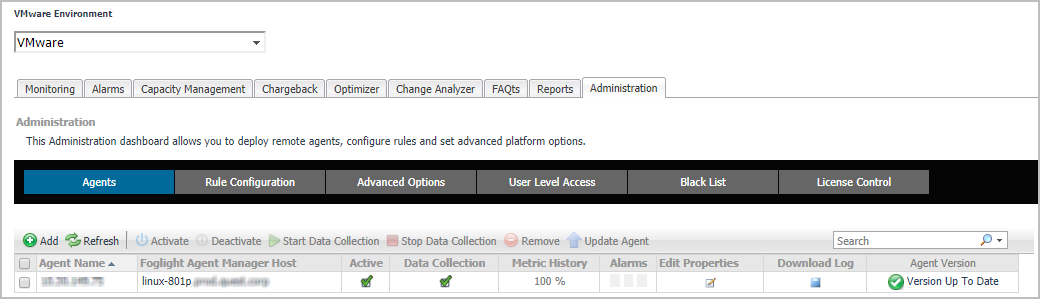
On the VMware Environment dashboard that appears in the display area, open the Administration tab. |
Foglight® for VMware uses the VMware Performance Agent to collect information from monitored environments. Creating a VMware Performance Agent instance creates the agent process on the Agent Manager host. Activating the VMware Performance Agent starts that agent process while starting an agent instance’s data collection enables the agent to start collecting data from the monitored vCenter® and to send it to Foglight for VMware.
When the VMware Performance Agent package is successfully deployed, create one or more agent instances, activate them, and start their data collection. To perform these steps in a single operation for one or more monitored hosts, use the Agents view on the Administration tab.
Each VMware Performance Agent monitors a single Virtual Center. When you create a VMware Performance Agent instance and the Agent Setup wizard determines that the Virtual Center was not previously monitored by this Foglight instance, it starts importing historical data into Foglight. This data is not immediately available as it takes some time to collect it. This process can import data collected over 30 days or less, depending on the amount of data available in the Virtual Center. This allows you to explore VMware metrics as soon as the data is imported, instead for waiting for the agent to collect some data from the Virtual Center. The Metric History column in the Agents table indicates the progress of the historical data import. Historical data is intended for charting, trending, and general presentation purposes. It does not cause any alarms to fire.
|
2 |
|
3 |
On the VMware Environment dashboard that appears in the display area, open the Administration tab. |
|
4 |
|
a |
In the Virtual Center box, type the fully qualified name of the host on which the Virtual Center is running. |
|
b |
In the Port box, type the port number of the host running the Virtual Center that will be used by the VMware Performance Agent to connect to the Virtual Center. |
|
c |
If you want to enable the VMware Performance Agent to collect the Foglight Storage data, select the Enable Storage Collection check box. Foglight Storage can help you optimize the VMware environment by monitoring virtual storage and its underlying physical storage components. For more information about this product, see the Managing Foglight Manager Storage User and Reference Guide. |
|
d |
If you want to import historical data, select the Enable Historical Metric Data check box. This data is not immediately available as it takes some time to collect it. This process can import data collected over 30 days or less, depending on the amount of data available in the Virtual Center. Selecting this option allows you to explore VMware metrics as soon as the data is imported, instead for waiting for the agent to collect some data from the Virtual Center. |
|
e |
Click Next. |
|
• |
Add vCenter(s) to a new credential: Select this option if you want to create a new credential for the selected vCenter. Click Next and continue to Step 8. |
|
• |
Add vCenter(s) to an existing credential: Select this option if you want to use an existing credential for the selected vCenter. This option is suitable if an existing credential has the information needed to access the vCenter. Click Next and continue to Step 9. |
|
• |
Credential Name: Type a name that uniquely identifies the credential. |
|
• |
User: Type the vCenter user name. |
|
• |
Password: Type the vCenter password. |
|
• |
Confirm Password: Type the vCenter password. |
|
c |
Click Next. |
|
d |
Click Finish. |
|
b |
Click Next. |
|
c |
Click Finish. |
|
• |
<foglight_home> is a placeholder that represents the path to the Foglight Management Server installation. |
|
• |
<foglight_agent_mgr_home> is a placeholder that represents the path to the Foglight Agent Manager installation. This can be the location of the Foglight Agent Manager installation on a monitored host, or the home directory of the Foglight Agent Manager that comes embedded with the Foglight Management Server. For example: |
All the certificate-related command line options require that FglAM be up and running.
bin/fglam --add-certificate "user alias 1"=/path/to/certificate/file
|
• |
FglAM requires the Base64 format. To verify if the certificate file is encoded with Base64, open the certificate with a notepad and the certificate should be similar to the following example: -----BEGIN CERTIFICATE----- XXXXXXXX= -----END CERTIFICATE----- |
|
NOTE: If the certificate is not Base64 format, use openssl command to convert the certificate file into a Base64 file. Use either of the following commands depending on the source form: openssl x509 -inform DER -in xxx.cer -out xxx.crt or openssl x509 -inform PEM -in xxx.cer -out xxx.crt |
|
• |
The alias is required and is used in the list and delete operations to refer to the certificate. It can be anything. |
Print out a list of certificates and the aliases that refer to them.
Refer to the example output below:
Remove a certificate referred to by an alias.
bin/fglam --delete-certificate "user alias 1"
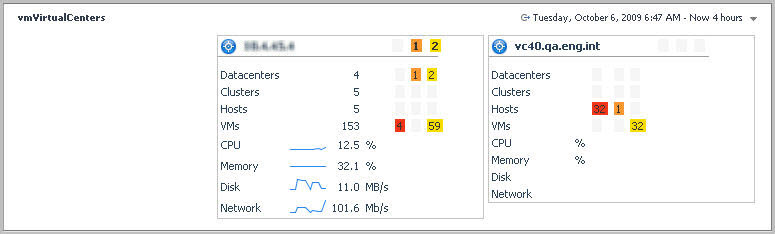
To access this dashboard, from the navigation panel, under Dashboards, choose VMware > VMware VirtualCenters.
For reference information about the data appearing on this dashboard, see VMware VirtualCenter views .