|
• |
|
1 |
From the Foglight navigation panel, select Dashboards > Exchange > Exchange Environment. |
|
2 |
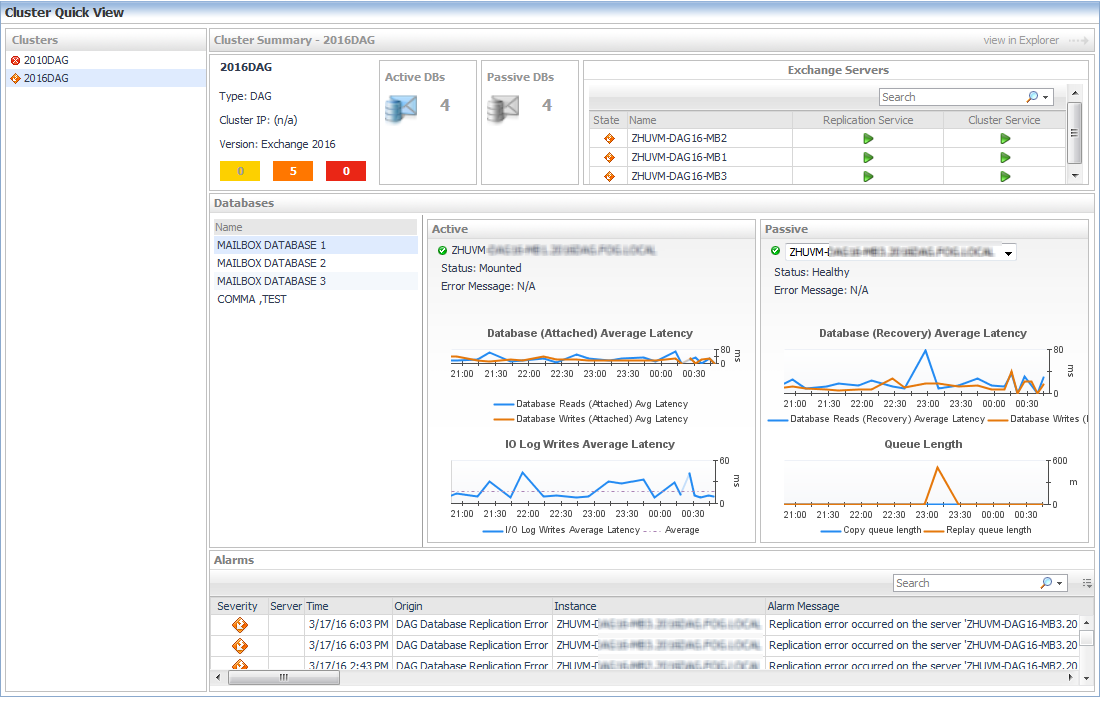
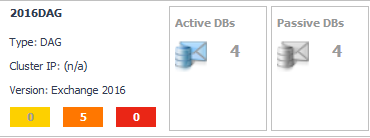
From the Monitoring tab, select the Clusters tile. |
The cluster tile displays the following information:
In addition to the cluster tile, the following embedded views are displayed:
|
1 |
From the Foglight navigation panel, select Dashboards > Exchange > Exchange Explorer. |
|
2 |
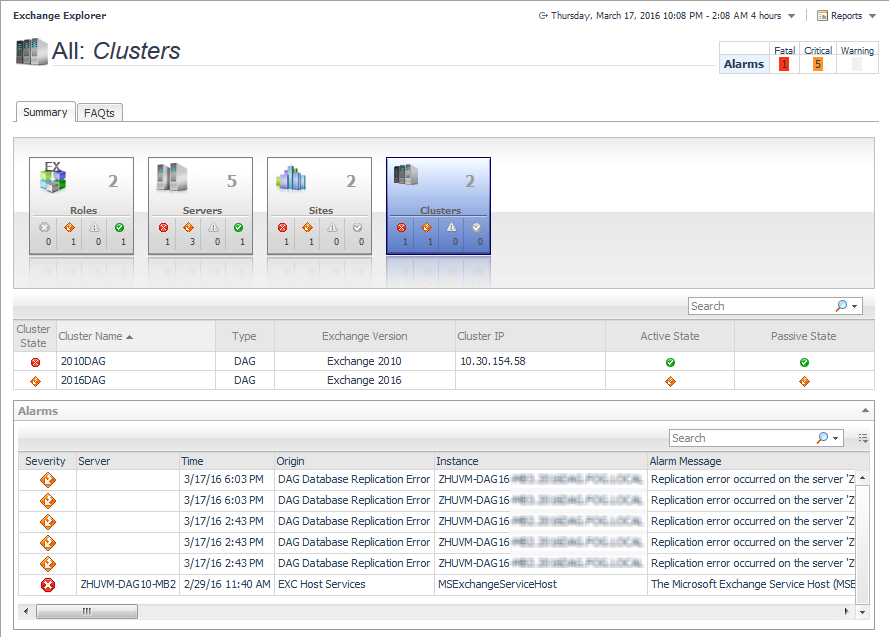
From the Exchange Infrastructure panel, select the Clusters object container. |
The following embedded views are displayed:
|
1 |
From the Foglight navigation panel, select Dashboards > Exchange > Exchange Explorer. |
|
3 |
Select the Summary navigation tab. |
|
NOTE: You can also click the view in Explorer link on that cluster’s Exchange Cluster Environment Summary view to display this view. |