This section covers the following topics:
This walkthrough describes how to open the Storage Explorer and select a storage device. If you select a top-level device type node, such as Fabrics, the Storage Environment quick view is displayed. For more information about the quick view, see Summary and Resource Information for each Collected Target:.
|
1 |
|
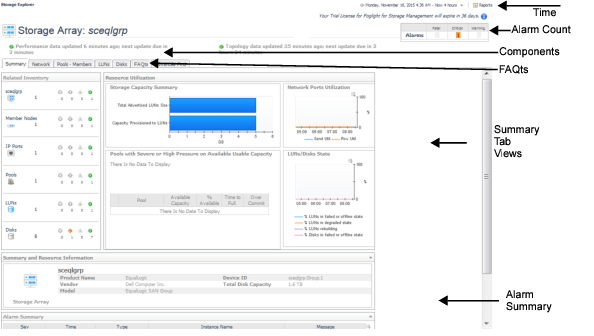
Displays counts of all the alarms at each severity level that are still active (not cleared) at the end of the displayed time range. Unlike the Alarm Summary view, the Alarm Count includes alarms for the device and all its child components. Click an alarm count to display the alarms at that severity level. | |||
|
When the Summary tab is selected:
| |||
|
When a component tab is selected:
| |||
|
Contains questions appropriate for the selected device type. For information on how to use a FAQts tab, see Asking Questions About the Monitored Storage Environment. | |||
|
1 |
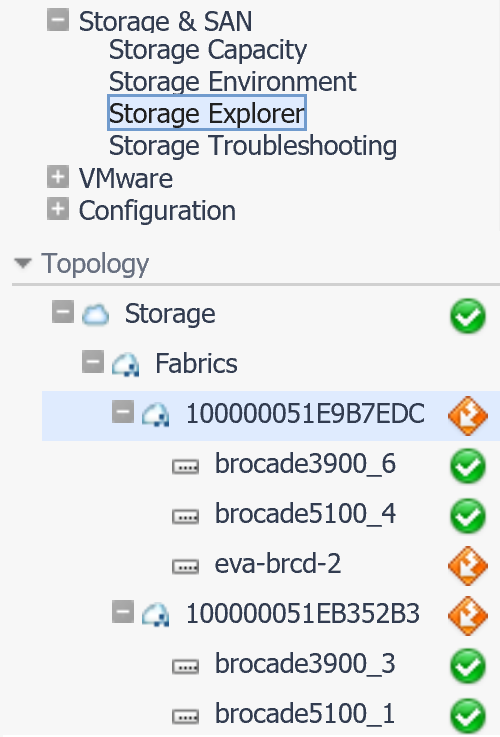
On the navigation panel, under Dashboards, click Storage & SAN > Storage Explorer. |
|
2 |
On the navigation panel, under Topology, expand Fabrics and select a fabric. |
|
3 |
If the Alarm Count displays alarms, you may want to assess the alarms before continuing with this walkthrough. Click a status count to open a list of device and component alarms. For more information, see Assessing Storage Alarms. |
|
4 |
In the Summary tab, review performance in terms of key metrics. |
|
• |
Summary and Resource Information. Displays physical details about the fabric. |
|
• |
FC Switch Detail. For each switch, displays the switch status, type of switch (physical or logical), and current value for Data Rate, followed by details about the ISL ports and N ports belonging to the switch. Ports details include the number of ports by alarm status and current values for Link Error Rate and Non-Link Error Rate. Click a |
|
• |
Alarm Summary. Displays alarms on this fabric. |
|
5 |
Click the ISL Ports tab. |
|
• |
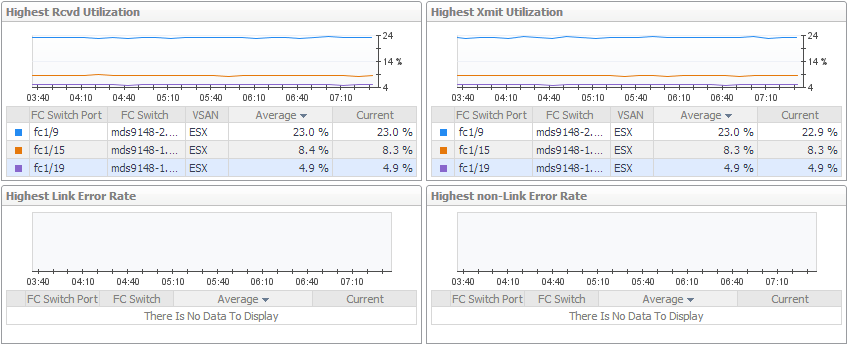
Highest charts. The charts display the top three ISL ports in the fabric with the highest average Data Rate, Link Error Rate, and Non-Link Error Rate, respectively. The tables show the average and current values for the ports. |
|
• |
Topology Table (Inter-Switch Connections). For each switch, identifies all ISL port connections with other switches in the fabric. |
|
• |
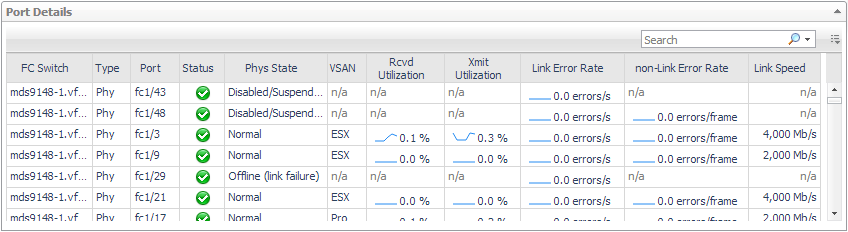
Port Details. For each switch-plus-port combination, displays the name and type of switch (physical or logical) and the port name, status, and physical state. The metrics represent current values for Rcvd Utilization, Xmit Utilization, Link Error Rate, Non-Link Error Rate, and Link Speed. Click a |
|
• |
Alarm Summary. Displays alarms on ISL ports. |
|
6 |
Click the N Ports tab. |
|
• |
Highest charts. The charts display the top three N ports in the fabric with the highest average Rcvd Utilization, Xmit Utilization, Link Error Rate, and Non-Link Error Rate, respectively. The tables show the average and current values for the ports. |
|
• |
Port Details. For each switch-plus-port combination, displays the name and type of switch and the port name, status, and physical state. The metrics represent current values for Rcvd Utilization, Xmit Utilization, Link Error Rate, Non-Link Error Rate, and Link Speed. Click a |
|
• |
Alarm Summary. Displays alarms on N ports. |
|
• |
|
1 |
On the navigation panel, under Dashboards, click Storage & SAN > Storage Explorer. |
|
2 |
On the navigation panel, under Topology, expand Fabrics, expand the target fabric, and select a switch. |
|
3 |
If the Alarm Count displays alarms, you may want to assess the alarms before continuing with this walkthrough. Click a status count to open a list of device and component alarms. For more information, see Assessing Storage Alarms. |
|
4 |
In the Summary tab, review performance in terms of key metrics. |
|
• |
Summary and Resource Information. Displays physical details about the switch. |
|
• |
Topology Table (Inter-Switch Connections). Brocade logical switches only. For each switch, identifies all ISL port connections with other switches in the fabric. |
|
• |
Alarm Summary. Displays alarms on the switch. |
|
5 |
Click the ISL Ports tab, if available. |
|
6 |
Click the N Ports tab. |
|
• |