Reviewing and editing PowerVM HMC agent properties
PowerVM HMC Agents collect data from your monitored PowerVM® infrastructure and send it to the Management Server. They keep track of resource utilization metrics and alerts you when applicable pre-defined thresholds are reached.
|
2 |
|
4 |
|
5 |
Click Modify the private properties for this agent. |
Configuring HMC Settings
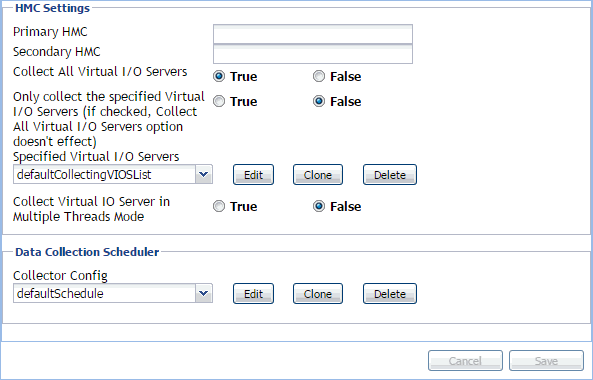
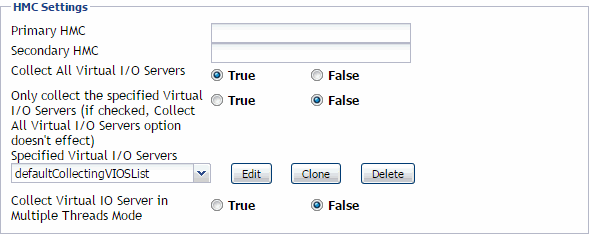
The HMC Settings specify general settings the agent needs to connect to the monitored environment.
|
• |
Primary HMC: The host name or IP address of the primary HMC the PowerVM Agent connects to for collecting data. |
|
• |
Secondary HMC: The host name or IP address of the secondary HMC the PowerVM Agent connects to for collecting data when the primary HMC is not connectable |
|
• |
Collect All Virtual I/O Servers: Indicates if the agent collects information about all monitored PowerVM virtual I/O servers (True), or only about those listed under Specified Virtual I/O Servers (False). |
|
• |
Only collect the specified Virtual I/O Servers: Indicates if the agent only collects information about PowerVM virtual I/O servers listed under Specified Virtual I/O Servers (True), or about all monitored PowerVM virtual I/O servers (False). If set to True, it overrides the Collect All Virtual I/O Servers property. |
|
• |
Specified Virtual I/O Servers: A list indicating which PowerVM virtual I/O servers to monitor. The settings in this list take place when Only collect the specified Virtual I/O Servers is set to True. |
|
• |
Virtual I/O Server Partition Name: The name of the PowerVM virtual I/O server partition. |
|
• |
Enable: Indicates whether to monitor the listed PowerVM VIOS. If selected, the PowerVM VIOS is monitored. If not selected, the PowerVM VIOS is not monitored. |
|
• |
Collect Virtual IO Server in Multiple Threads Mode: Indicates if the data collection runs with a single thread (False), or multiple threads (True). Running a multi-thread data collection allows the data collection process to run faster, but can cause a higher load on the PowerVM Virtual I/O Server. Since a VIOS has a role of an I/O bus in your monitored system, selecting this option is configurable, allowing you to select a desired type of collection, without compromising your overall system performance. |
Configuring Data Collection Scheduler properties
|
• |
Collector Config: A list identifying the data collectors the agent uses. Each entry in the list includes the following columns, allowing you to adjust the data collection settings for each individual collector: |
|
• |
Collector Name: The name of the collector: Essential Collection, Resource Collection (Resource, Disk, Network), and Inventory Collection. |
|
• |
Default Collection Interval: The length of the default collection interval. |
|
• |
Time Unit: The time unit for measuring the default collection interval: milliseconds, seconds, minutes, hours, or days. |
|
• |
Fast-Mode Collection Interval: The length of the collection interval when the agent is running in fast mode. |
|
• |
Fast-Mode Time Unit: The time unit of the collection interval when the agent is running in fast mode. |
|
• |
Fast-Mode Max Count: The maximum count of entries when the agent is running in fast mode. |
Monitoring your PowerVM environment
You can monitor the performance of PowerVM® servers, PowerVM partitions, and PowerVM Virtual I/O servers on the Monitoring tab of the Infrastructure Environment dashboard. The information appearing on this dashboard can tell you how well the selected monitored objects are performing given the current workload, and to discover potential resource-level issues, typically indicated by higher than usual processor, memory, and disk storage usage. This allows you to pro-actively reallocate resources where they are most needed, and to prevent service interruptions before they happen.


