Getting Started
Creating a NetVault Agent
Each NetVault Agent monitors the assets inside the selected NetVault Backup environment. To enable the data collection for Foglight for NetVault, create a NetVault user with the “Monitor Presets” privilege, as well as grant this user with the access to the client groups and media groups that you want to monitor.
|
2 |
|
3 |
|
4 |
Select Agent Host: Select the agent manager on which the new agent is to be deployed, and then click Next. |
|
5 |
NetVault Properties: Specify the following values, and then click Finish. |
|
• |
Server Address: The IP address of the NetVault Server that hosts the agent instance. |
|
• |
Port: The port number used by the NetVault Server for listening to the connections from the agent instance (default: 8443). |
|
• |
Use Https: The option used to enable the agent connection using HTTPS (default: true). |
|
• |
Login Username: The name of the user that has the privileges required for connecting to the NetVault Server and retrieving information. |
|
• |
Login Password: The password of the user that has the privileges required for connecting to the NetVault Server and retrieving information. |
|
• |
Error Event Keywords: Keywords used to classify NetVault error events. Separate multiple keywords by comma. |
|
• |
Warning Event Keywords: Keywords used to classify NetVault warning events. Separate multiple keywords by comma. |
|
• |
Collected Event Classes: The option used to indicate which event classes will be collected by the agent instance. By default, all event classes available in the NetVault Server are checked. |
|
• |
Collect Log Level: The option used to indicate which logs will be collected by the agent instance. Warning and above is set by default. |
Configuring data collection interval
|
1 |
|
2 |
On the Agent Status dashboard, select the NetVault agent that you want to monitor, and then click Edit Properties. |
|
3 |
|
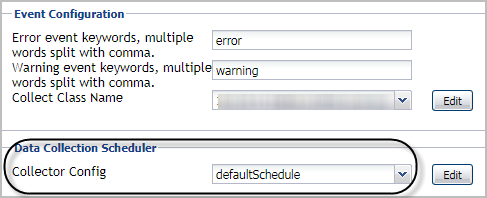
NOTE: Quest highly recommends setting the Collector Config (also knowns as Collection interval) to a value that is larger than 10 minutes and is multiples of 10 minutes; otherwise the NetVault agent might not collect metrics from the NetVault Server. |
Heat Map Analytics
|
• |
Topology Type: Indicates the monitored topology object, including Backup Server, Backup Client, Device Library, and Job. |
|
• |
Size Metric: Populates a rectangle based upon the selected metrics. For example, if you select Data Stored from the Size Metric drop-down list, the rectangle area will be populated based on the data stored in the topology object. |
|
• |
Rendering related metrics: For example, if you select Space Available and Red to Green, the rectangle of the topology object that has more available spaces will be rendered in red. |
|
• |
Color Pattern: Offers two patterns, Red to Green (larger value shows in red) or Green to Red (larger value shows in green). |
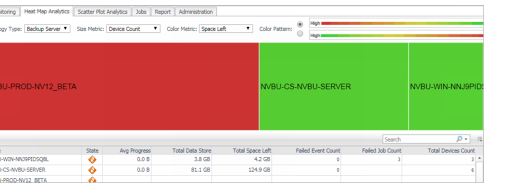
Figure 2 shows an example of heat map. This sample diagram represents the NVBU-PROD-NV12_BETA has the maximum amounts of devices and remaining spaces while NVBU-WIN-NNJ9 has the minimum amount. If you switch the Color Pattern, then NVBU-PROD-NV12_BETA will turn to green and NVBU-WIN-NNJ9 will show in red.


