Setting the Data Collection Scheduler Properties
|
• |
Collector Config: A list containing the data collectors the agent uses. Each entry in the list includes the following columns: |
|
• |
Collector Name: The name of the collector the vCloud Director Agent uses to gather data. |
|
• |
Default Collection Interval: The number of milliseconds, seconds, minutes, hours, or days during which the vCloud Director Agent collects data. |
|
• |
Time Unit: The time unit associated with the Default Collection Interval. |
|
• |
Fast-Mode Collection Interval: The number of milliseconds, seconds, minutes, hours, or days during which the vCloud Director Agent collects data when working in the fast collection mode. |
|
• |
Fast-Mode Time Unit: The time unit associated with the Fast-Mode Collection Interval. |
|
• |
Fast-Mode Max Count: The maximum number of the times the vCloud Director Agent can stay in fast collection mode. |
Investigating Resource Consumption Levels
When you deploy Foglight™ for vCloud Director and set up the monitoring agents for data collection, a set of predefined dashboards enables you to review the performance of your virtual system at a glance. They allow you to ensure consistent application performance, by drilling down for details from higher-level components to physical servers and virtual machines, and viewing details about each component, such as CPU utilization and network I/O.
Exploring your vCloud Director Environment
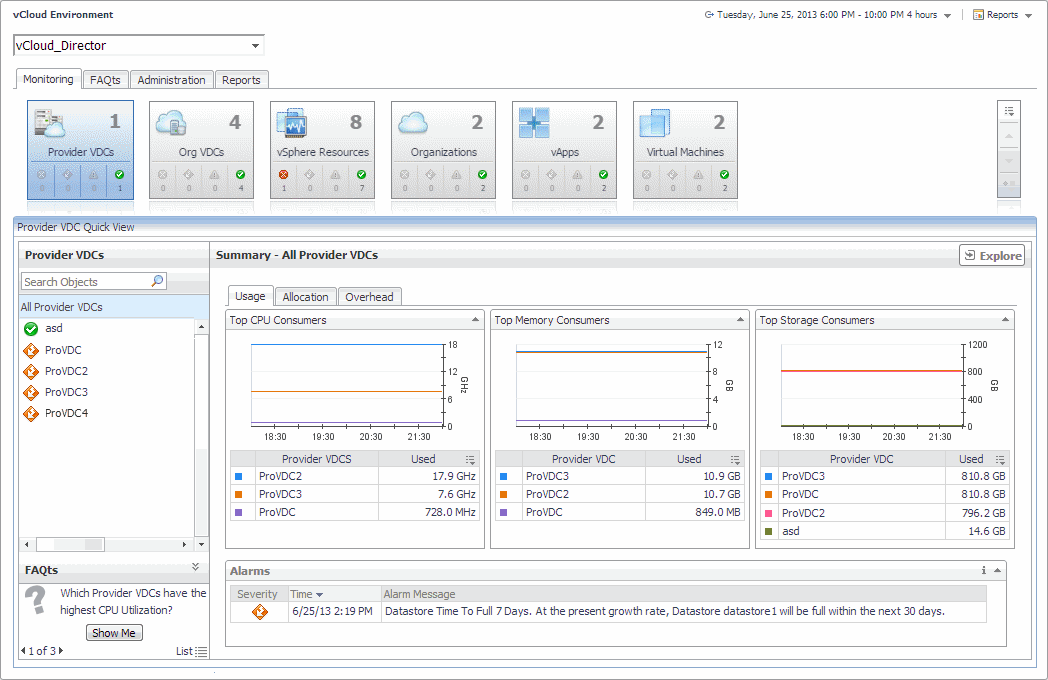
A typical vCloud Director® environment contains a set of vDCs, organizations, and virtual machines. You can view the overall state of these components on the vCloud Environment dashboard. To access this dashboard, under Dashboards, choose vCloud Director > vCloud Environment.
This dashboard provides a set of tabs, each displaying a different aspect of your monitored system:
|
• |
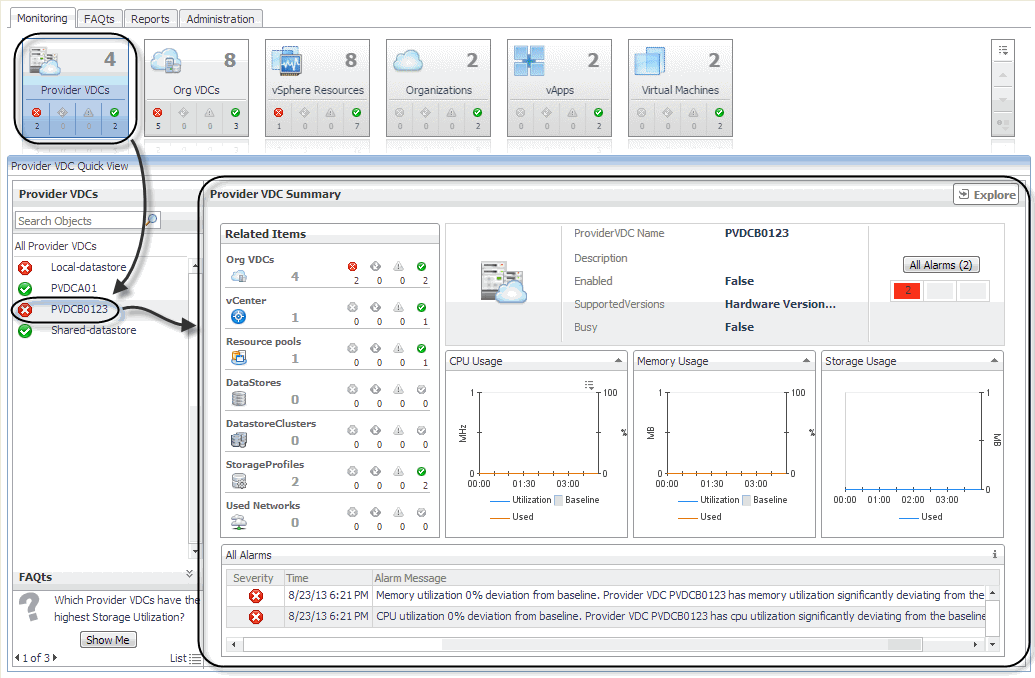
Monitoring: Use this tab to review data specific to the main components of your monitored environment such as provider vDCs, organization vDCs, vSphere resources, organizations, and virtual machines. This describes the features available on this tab. |
|
• |
FAQts: Use this tab to review the answers to common questions about your monitored systems. For more information, see Reviewing Frequently Asked Questions. |
|
• |
Reports: Use this tab to find out more about predefined templates that can be used to report on the various aspects of your virtual environment. For more information, see Generating Reports. |
|
• |
Administration: Use this tab to discover vCloud server groups and to manage vCloud Director agent instances. For more information, see Setting Up Monitoring Agents . |
When you navigate to the vCloud Environment dashboard for the first time, the Monitoring tab appears open. This tab provides an overall summary of your monitored environment.


