지금 지원 담당자와 채팅
지원 담당자와 채팅

Foglight for Citrix XenDesktop and XenApp 5.7.7 - User Guide

Getting started Setting up data collection agents Monitoring the performance of your XenDesktop environment

Exploring the alarm table

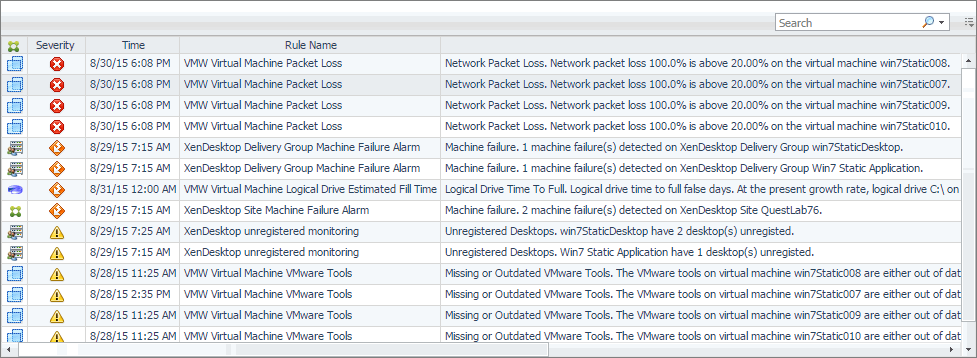
The XenDesktop Alarms dashboard displays a table containing all alarms fired against your monitored objects. For each alarm entry, it displays the associated object type, the alarm severity, when it was generated, the rule name that triggered the alarm, and the alarm message.

Figure 68. Alarm table

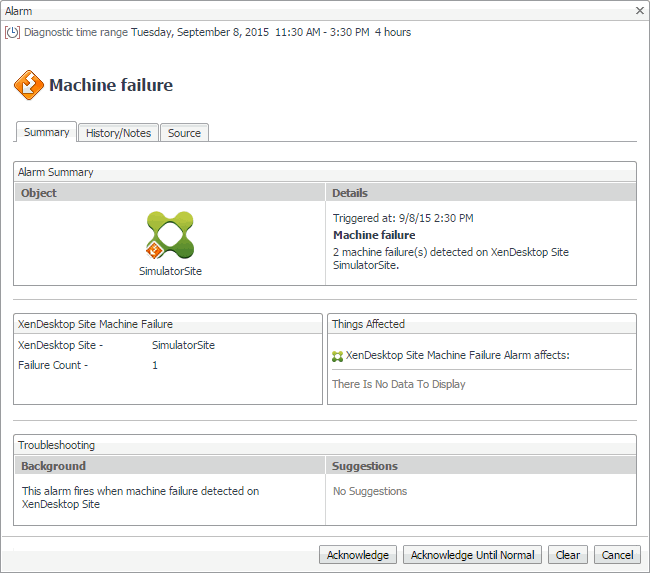
Clicking any row in the table displays the Alarm dialog box, containing additional details about the alarm.

Figure 69. Alarm dialog box

Reviewing Frequently Asked Questions

Foglight for Citrix XenDesktop and XenApp offers a collection of frequently asked questions that provide quick insight into resource utilization levels for the applications, desktops, user sessions, and the overall infrastructure in your monitored system. The question mechanism is interactive, guiding you to choose a category and specify additional parameters.

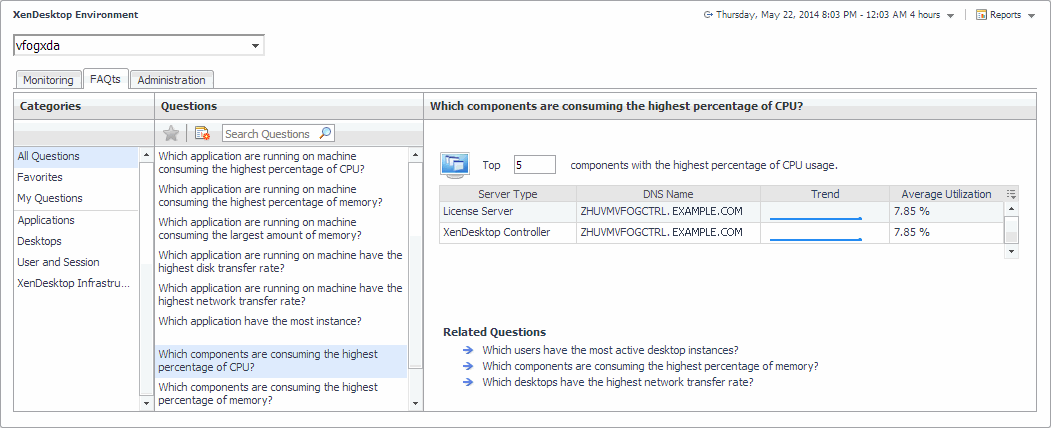
You can find the available questions on the FAQts tab of the XenDesktop Environment dashboard.

Figure 70. FAQts tab

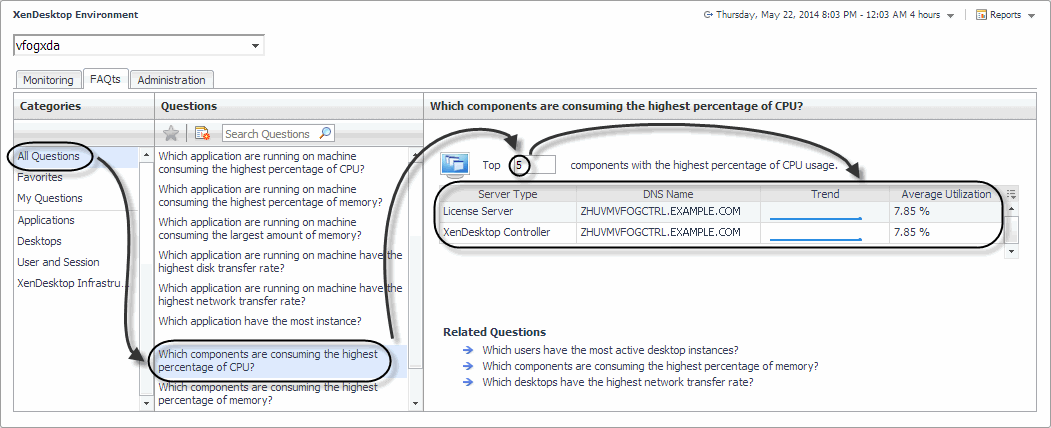
On this tab, the Categories pane several question groups. Selecting a category shows the questions belonging to that category in the Questions pane. From there, clicking a question shows the answer on the right.

Generating reports

Foglight for Citrix XenDesktop and XenApp includes a report generation ability. This allows you to create reports using a set of predefined templates to report on the various aspects of your virtual environment. Foglight for Citrix XenDesktop and XenApp includes a collection of predefined report templates.

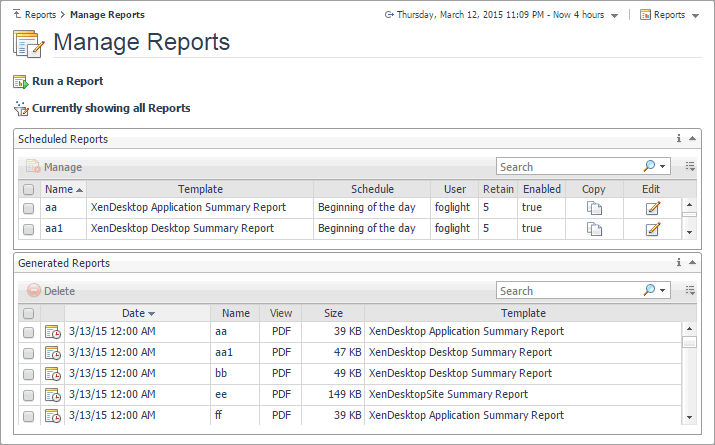
You can generate, copy, and edit reports using the Manage Reports dashboard included with the Management Server.

For complete information about this dashboard, see the Foglight User Help.

The following templates are available with Foglight for Citrix XenDesktop and XenApp.

Find out which applications have the most instances, and to identify the ones with the slowest application sessions, highest CPU and memory utilization, and highest I/O transfer rates.

Find out which desktops have the most sessions, and to identify the ones with the slowest sessions, highest CPU and memory utilization, and highest I/O transfer rates.

Review general information about the monitored XenDesktop site along with performance trends in session counts, logon duration, machine and connection failures. This report also provides general information about the existing delivery groups along with performance trends in their session counts, connected users, machine and connection failures.


관련 문서

The document was helpful.

평가 결과 선택

I easily found the information I needed.

평가 결과 선택