지금 지원 담당자와 채팅
지원 담당자와 채팅

Foglight for Sybase 5.9.3.10 - User and Reference Guide

Using Foglight for Sybase
Exploring the Sybase Dashboards About the Sybase_MDA Agent About the Sybase_RS Agent Generating SybaseMDA Reports
Reference

Disk I/O Dashboard

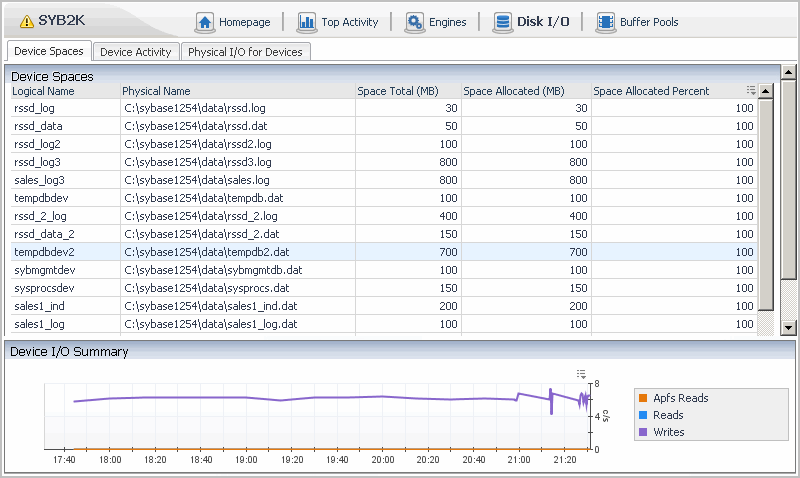
The Disk I/O dashboard provides performance details for read/write operations. This dashboard contains the following:

Device Spaces Tab

Devices spaces information is provided in a table and a chart:

Logical Name

The logical name of the device.

Physical Name

The physical name of the device with directory path.

Space Total (MB)

The total memory space available to this device, in megabytes.

Space Allocated (MB)

The total memory space allocated to this device, in megabytes.

Space Allocated Percent

The percentage of device space allocated in the device space available.

Device I/O Summary

The following three values, plotted over time:

Device Activity Tab

Device activity information is provided in a table and a chart:

Drill down by clicking on any device. A Sybase Disk I/O Detail chart appears.

Device Info

Logical Name

The logical name of the device.

Physical Name

The physical name of the device with directory path.

Last Sample

Writes

The number of writes for the selected time range.

Reads

The number of reads for the selected time range.

APF Reads

The number of APF (Asynchronous Prefetch Activity) reads for the selected time range.

Time Range Period:

Total I/O

The total number inputs and outputs for the selected time range.

You can drill down by clicking on any field in this column. A popup appears showing the following three values, plotted over time:

Writes avg

The average number of writes for the selected time range.

Writes count

The number of writes for the selected time range.

Reads avg.

The average number of reads for the selected time range.

Reads count

The number of reads for the selected time range.

APF Reads avg.

The number of APF (Asynchronous Prefetch Activity) reads for the selected time range.

APF Reads count

The average number of APF (Asynchronous Prefetch Activity) reads for the selected time range.

IO/sec

The number of inputs and outputs per second.

Msec/IO

The number of milliseconds per input/output.

Device I/O Summary

The following three values, plotted over time for all of the monitored devices:

Physical I/O for Devices Tab


Physical Writes (All Devices)

The number of physical writes for each device, plotted over time.

Physical Reads (All Devices)

The number of physical reads for each device, plotted over time.

관련 문서

The document was helpful.

평가 결과 선택

I easily found the information I needed.

평가 결과 선택