Our prospects want to see the actual memory assigned, used, free, etc in mb not percentage.\
I do not see it under host memory dashboard, and I don't see it when I'm exploring data metric either.
Does foglight do not collect the memory in MB/GB or we missing something?
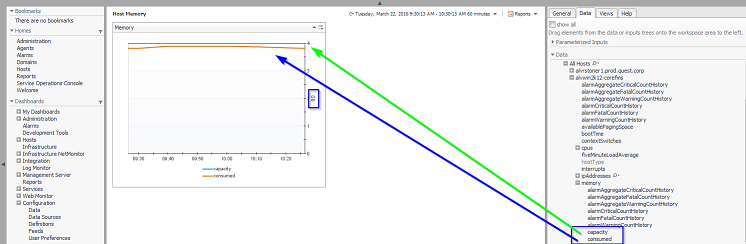
The Host:Memory topology objects Capacity & Used can be used in a drag-drop dashboard to display the collected values.