While Performance Monitor can be used for monitoring performance parameters of SQL Server, it doesn’t provide an option to get notifications when certain performance metrics values breach specified thresholds. The main reason why this is important is to be able to identify SQL Server performance issues as soon as possible, and react before they affect too many users. In addition, notifications on potential SQL Server performance issues could help avoid more serious problems by forecasting when they are likely to occur in order to avoid them. Therefore, one of the primary tasks for the database administrator is to establish a system that will ensure that he/she is going to be notified in case when certain performance metrics values are beyond the expected/desired range
SQL Server itself has native functionality that allows for notifications when a performance exception occurs. Using the SQL Server Agent subsystem, or more precisely SQL Server Agent alerting component, a database administrator can establish a system that will allow him to get notifications for SQL Server performance issues he/she wants to be notified about
The first step in creating a notification system for SQL Server performance issues is to create a SQL Server Agent operator. This is an often overlooked step in situations when an alert is created for the first time, but this is important as SQL Server Agent requires proper setup of the operator(s) to ensure sending an e-mail notification when alert occurs
An operator can be created using SQL Server Management Studio or directly via T-SQL.
To create a new operator using SSMS, the following must be completed:
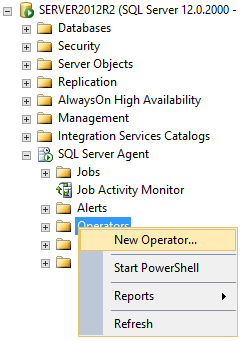
Open SSMS and expand the SQL Server Agent node
Using context menu of the Operators tree node, open the New Operator dialog

When the New Operator dialog shows up, enter the name of the operator and specify the E-mail name (email address) and if needed pager e-mail name in the Notification options section of the dialog
|
Quick tip: Net send option will not be functional on computers that don’t have a live network connection. This is valid even in the situation where both, the source and destination of the net send are located on the same computer. In addition, Net send will not work if the Messenger service on SQL Server is not started on a machine that is used for sending and on machine used for receiving of the Net send message. Microsoft discontinued the Messenger service starting with Windows Server 2008 and after taking in consideration general deficiencies in the Net send feature, using email primarily (and pager notifications optionally) is much more reliable option |
After the operator is created, the next step would be to create performance alerts:
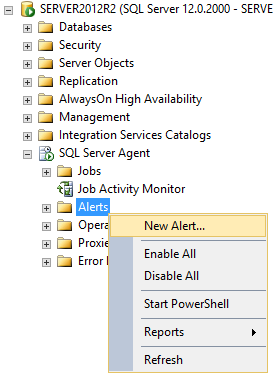
In the context menu of the Alerts node, select New Alert

Enter the alert name (any name of user preference)
Chose SQL Server performance condition alert from the type drop down menu
In the Performance condition alert definition section determine the performance object and counter for which alert should be triggered
In Alert if counter select the condition and set the desired threshold value for the specified counter
Now go to the Response tab and check the Notify operators checkbox. Check the E-mail checkbox and optionally the Pager check box
The Options tab allows user to use Include alert error text in option within email body and/or pager notification text. If any custom message has to be delivered with each notification sent to email or pager, enter the message in the Additional notification message to send text box
The same steps have to be repeated for each and every performance metric for which the notification is required
As it can be seen, the Performance monitor actually ensures basic ability for notifying the user when a user defined threshold value is reached, but there are a few drawbacks that have to be mentioned:
No options exist to execute actions automatically when alert occurs
No ability exists for aggregate email on alerts for specific period of time etc.
No options exist for alerting schedules, which can cause excessive alerting during SQL Server maintenance periods
Hard to maintain in cases when the SQL Server environment is prone to changes
These drawbacks individually may not be showstoppers, but combined often preclude Performance Monitor from being a viable solution for many DBAs.
ApexSQL Monitor is a SQL Server and operating system performance monitoring tool that uses a set of built in operating system, SQL Server, and database performance counters to ensure real time monitoring of SQL Server performances. In addition, ApexSQL Monitor allows the user to create an unlimited number of custom designed metrics to match specific requirements in monitoring od SQL Server performance. Built in and custom metrics values can be graphically presented in charts. Performance metrics are highly configurable and for each the user can specify whether to raise an alert when a specified metric value is reached. The user can set his own thresholds for low, medium, and high severity alerts, or it can use baseline calculated threshold values for triggering alerts
Besides having advanced alerting abilities, ApexSQL Monitor has addressed and overcome drawbacks in Performance Monitor, allowing the user full flexibility in defining alerts and notifications . In order to put notifications on certain performance metrics, it must be ensured that performance monitoring and alerting is turned on for those metrics. To do that it must use the Metrics button in the Configure menu
ApexSQL Monitor comes with predefined set of alerts threshold values for low, medium and high alerts and this is the set of values that should work well on most systems, but users have the full freedom to configure alerting in the way that will suits their needs. To properly understand how the advanced alerting system implemented in ApexSQL Monitor works and to properly setup the alerts to avoid unnecessary alerting, please refer to the How to suppress excessive alerting using Alert periods knowledgebase article
Please note that some alerts are not turned on by default, as these could be heavily dependent on the individual system configuration and load, so these have to be set by the user according to its system specifics. Alternatively database administrators can just calculate baselines and let ApexSQL Monitor measure against the baseline calculated values for statistical deviations. Performing baseline calculated thresholds can be done in a few simple steps
In the Metrics screen, click on the Calculate baseline link that will open the Calculate baseline dialog. Select the desired time range and select the metrics for which you want to perform baseline calculations. The baseline calculation should be performed for the “good” period of SQL Server functionality (period when SQL Server wasn’t affected by some serious issues), and it is recommended that all metrics are included in calculation. It is always good to have baseline calculated thresholds at hand even if you opt not to use them by default
For how to set up email profiles, please refer to the Working with email notifications and email profiles in ApexSQL Monitor knowledgebase article. In situations when you don’t want to have alerts raised during the regular SQL Server maintenance windows, please refer to the How to create and schedule maintenance periods in ApexSQL Monitor knowledgebase article
Once this is configured, ApexSQL Monitor will trigger an alert whenever a specific alert condition is meet and will send an email to user with all the relevant information. ApexSQL Monitor will also store each and every alert in the repository database so that the user can review the triggered alerts and resolve them according to priority. All stored alerts are conveniently displayed and to see them, just click on the Alerts button in the View menu
Now we have all alerts displayed. When an alert is triggered by ApexSQL Monitor it will stay raised until the database administrator in charge for specific SQL Server resolves it
By selecting the Details tab in the lower pane, the database administrator can review alert details and resolve alert by selecting one of the offered alert status that can be chosen from the drop down menu. It is important that alerts are timely inspected and resolved, as this is the only way to keep the alert list up to date which will make this screen an excellent start point for troubleshooting any SQL Server performance issues that occurs