サポートと今すぐチャット
サポートとのチャット

SQL Optimizer for Oracle 9.3.3 - User Guide

Welcome to SQL Optimizer
About SQL Optimizer SQL Optimization Workflow New in This Release Additional Resources Database Privileges Database Privileges Script Connect to the Database Windows Layout Customize Toolbars Keyboard Shortcuts Support Bundle Register SQL Optimizer Check for Updates SQL Operations
ALL PARTITION ALTER INDEX AND EQUAL ANTI JOIN BITMAP AND BITMAP COMPACTION BITMAP CONSTRUCTION BITMAP CONVERSION BITMAP INDEX BITMAP JOIN INDEX UPDATE BITMAP JOIN INDEX UPDATE STATEMENT BITMAP KEY ITERATION BITMAP MERGE BITMAP MINUS BITMAP OR BUFFER SORT CARTESIAN JOIN COLLECTION ITERATOR CONCATENATION CONNECT BY CONNECT BY PUMP COUNT COUNT STOPKEY CREATE AS SELECT CUBE SCAN DDL STATEMENT DELETE DOMAIN INDEX FAST FULL INDEX SCAN FILTER FIRST ROWS FIXED INDEX FIXED TABLE FOR UPDATE FULL INDEX SCAN FULL INDEX SCAN DESCENDING FULL INDEX SCAN (MIN/MAX) HASH GROUP BY HASH GROUP BY PIVOT HASH JOIN HASH JOIN BUFFERED HASH PARTITION HASH UNIQUE INDEX INDEX BUILD NON UNIQUE INDEX RANGE SCAN INDEX RANGE SCAN DESCENDING INDEX RANGE SCAN (MIN/MAX) INDEX SAMPLE FAST FULL SCAN INDEX SKIP SCAN INDEX SKIP SCAN DESCENDING INDEX UNIQUE SCAN INLIST ITERATOR INLIST PARTITION INSERT INTERSECTION INTO INVALID PARTITION ITERATOR PARTITION LOAD AS SELECT MAT_VIEW ACCESS MAT_VIEW REWRITE ACCESS MERGE JOIN MINUS MULTI-TABLE INSERT NESTED LOOPS OUTER JOIN PARTITION PARTITION HASH EMPTY PARTITION LIST PARTITION RANGE PROJECTION PX BLOCK ITERATOR PX COORDINATOR PX ITERATOR PX PARTITION PX PARTITION HASH ALL PX PARTITION LIST ALL PX PARTITION RANGE ALL PX RECEIVE PX SEND RANGE PARTITION RECURSIVE EXECUTION RECURSIVE WITH PUMP REFERENCE MODEL REMOTE SELECT SEMI JOIN SEQUENCE SINGLE PARTITION SINGLE RANGE PARTITION SORT SORT AGGREGATE SORT GROUP BY SORT GROUP BY CUBE SORT GROUP BY NOSORT SORT GROUP BY ROLLUP SORT JOIN SORT ORDER BY SORT UNIQUE SQL MODEL TABLE ACCESS TABLE ACCESS BY GLOBAL INDEX ROWID TABLE ACCESS BY INDEX ROWID TABLE ACCESS BY LOCAL INDEX ROWID TABLE ACCESS BY ROWID TABLE ACCESS BY USER ROWID TABLE ACCESS CLUSTER TABLE ACCESS FULL TABLE ACCESS HASH TABLE ACCESS SAMPLE TABLE QUEUE TEMP TABLE GENERATION TEMP TABLE TRANSFORMATION UNION UNION ALL UNION ALL (RECURSIVE WITH) UNPIVOT UPDATE VIEW VIEW PUSHED PREDICATE WINDOW
Optimize SQL
Create Optimize SQL Sessions Open Optimizer SQL Sessions Rewrite SQL Generate Execution Plan Alternatives
Optimize Indexes Batch Optimize SQL Scan SQL Inspect SGA Analyze Impact Manage Plans Configure Options SQL Optimizer Tutorials About Us Legal Notices

Test Run Different Bind Values

For SQL statements that contain a bind variable, you can use the Test Run Different Bind Values tab in Optimize SQL to test run SQL alternatives against a number of different bind values. This feature allows you to evaluate how one alternative performs against different bind values. In addition, you can compare the performance of different alternatives across a whole range of bind values within one test run.

You can manually enter bind values or import values from a .txt or .csv file. You can also find and use bind values captured by Oracle. If you import multiple values from a file, you can then select all or a subset of those values to test run. This allows you to easily reuse the same source file of bind values.

To use the Test Run Different Bind Values feature, your SQL must be valid and must contain at least one bind variable.

To test run SQL alternatives with different bind values

  1. Select the Optimize SQL tab in the main window.

  2. Select a SQL Rewrite or Plan Control Session.
  3. Enter a SQL statement with a bind variable.
  4. Click to generate SQL alternatives. See Optimize SQL Statements for more information about generating SQL alternatives.
  5. Test run the SQL alternatives in the SQL Details tab to find the best performing statements.
  6. After the test-run process is finished, select the Test Run Different Bind Values tab.
  7. In the Test Run Different Bind Values tab, select the alternatives you want to test run again using a range of bind values.
    • Select one or more (or all) alternatives by selecting the check box beside each SQL alternative.
  8. Click Define Bind Values in the breadcrumb navigation (upper panel) or click the Next->Define Bind Values button.
  9. Use the Define Bind Values page to build a list of values to use. You may want to test run the best performing alternatives against your most important bind values.
    1. If you want to change the data type for a bind variable, click the data type link in the header.
    2. The bind values you used to test run alternatives in the SQL Details tab are entered by default in Set 1.
    3. A Set consists of one bind value for each variable in the SQL statement.
  10. To specify multiple bind value sets, use one or more of the following methods. You can use more than one method to add to the list of values.
    • To manually enter values, click in the last row of the grid and enter a bind value or set of values. Repeat this process until your list is complete.
    • To find available bind values captured by Oracle and use these to populate the list, click .
    • To import values from a delimited .txt or .csv file, click .
    • To browse for values, use the Data Browser pane. See Set Bind Variables for more information.
  11. You can rename each set. Click within the Set Name column for each set and enter a name.
  12. Duplicate value sets and duplicate names are not allowed and are flagged ! for easy identification.
  13. To delete a set, select it and click . To export the list of bind values and save it as a file, click .
  14. When the list of bind values is complete, click Next->Finish Setup.
  15. In the Finish Setup page, select one of the following options:

    Test run only the newly added or modified

    (Applicable only when modifying a current test run)

    Select this option to test run only the alternatives you added and/or the bind value sets you added or modified.

    Test run all SQL using every set of bind values

    OR

    Test run everything again

    Select this option if you want to immediately test run all the SQL alternatives you selected using all the bind values you specified.
    Let me select what to test run Select this option if you want to select which SQL alternatives to test run or which bind values to use.
  16. Click Finish Setup.
    • If you selected to test run immediately, the Test Run Settings dialog opens. Specify test-run options for this test run and click Start Test Run. See Test Run Settings for more information.

      SQL Optimizer runs the SQL alternatives you selected using each bind value set you defined.

    • If you selected Let me select what to test run, a page opens allowing you to select which SQL alternatives to test run and which bind values to use.

      Make your selections and then click Finish Setup.

      If you selected to test run multiple alternatives, the Test Run Settings dialog opens. Specify test-run options for this test run and click Start Test Run. See Test Run Settings for more information.

  17. During the test run, view test-run progress in the Summary pane.
  18. Click to abort the currently executing bind value set.
  19. Click to stop the test run process. See Stop and Resume the Optimization Process for more information.

To review test-run results

  1. Summary pane. When the test-run process is finished, the Summary pane displays a summary of results for the selected alternatives you tested.

    • To modify the list of alternatives or bind values and then rerun, click one of the View/Modify links in the Summary pane.
  2. Alternatives pane. The Alternatives pane displays the run-time statistics.
    • The master grid shows test-run status and run-time averages for each alternative using all bind value sets.
    • Click + next to each alternative to expose the run-time statistics for each bind value set. Grids are nested for easy viewing.
    • The nested grids show the run-time statistics for each execution of an alternative with one bind value set.
    • Review the Performance for Bind Sets column—The graph in this column displays the relative performance within the group of bind values. Use this chart to observe variation in SQL performance when different bind values are used. Then compare the differences in the amount of variation for different alternatives.

      Click the Average Elapsed Time link to change the statistic used to draw the graph. (Changing the performance statistic in this column changes it for all grids and the performance charts.)

  3. Review the Performance Charts to see performance information for the top SQL.
    • The chart displays the top ten (or less) alternatives based on the selected performance criteria.
    • You can select which top alternatives to display by selecting alternatives in the selection pane.
    • Click the Average Elapsed Time link to change the performance criteria displayed in the chart (and the grids).
    • Use the cursor to hover over the chart to display performance details for each top alternative.
    • Select Show distribution (Overall performance view) to display the actual data points. This allows you to see the distribution of test-run results for the different bind value sets. You can gauge how stable the performance of an alternative is, based on this distribution, e.g., are results clustered or dispersed.
    • If a SQL was terminated, the Number of incomplete test runs is represented by a red bar below the x axis. The number represents the bind value sets that were not test run.

      To show more or all terminated test runs, in the field directly above the performance chart, click the link to increase the number of terminated test runs to display.

    • In the View field, you can select to display either the Overall performance or the Performance variation view.
    • In the Performance variation view, you can change the chart line color for an alternative. Click the color-coded alternative name in the legend/selection pane and select a color from the palette.
  4. To rerun one or more alternatives from the results page, select one of the test-run actions from the toolbar. See Test Run SQL Alternatives for more information about test run actions.
  5. Return to the SQL Details tab—You can return to the SQL Details tab at any time to perform Optimization / Test Run tasks. Some actions on the SQL Details tab, such as deleting alternatives, can result in changes to your Test Run Different Bind Values results. If you attempt an action that may affect your Test Run Different Bind Values results, SQL Optimizer warns you.


Related Topic


Use Execution Plans

About Execution Plans

The execution plan displays the steps a database takes to execute a SQL statement. You can use the execution plan to determine if a statement is efficient.

In the step formats (like Tree Plan) each step indicates how SQL Optimizer retrieves rows of data. The steps are numbered in the order of execution to make the plan easier to read.

Oracle executes each child operation before the parent operation. For some SQL statements, Oracle executes the parent operation once it retrieves a single row from the child operation. Other SQL statements require that Oracle retrieve all rows from the child operation before it executes the parent operation.

Reviewing Execution Plans

Use the Execution Plan window to review the execution plan for the original SQL statement or selected alternative. Several display options and configurations are available.

You can select an execution plan format, configure plan content, and customize plan text.

To select a plan format

  1. Right-click the execution plan and select View Plan | option.
  2. Select one of the following formats:
    • Tree Plan—Displays plan as tree view with numbered steps.
    • DBMS_XPlan (Formatted)—Displays plan using the DBMS_XPLAN output with added formatting.
    • DBMS_XPlan (Plain Text)—Displays plan using the DBMS_XPlan output as plain text. This is the format returned by Oracle.
    • Graphic Plan—Displays a graphic view of the plan. Includes numbered steps.
    • MS Graphic Plan—Displays a graphic type view. Includes numbered steps.
    • Plain Language Plan—Lists steps using descriptions in plain language.
  3. Go to Review Execution Plans to learn more about the different plan formats and how to customize them.

Execution Plan Window - Optimize SQL

The Execution Plan window displays the available execution plans. Each tab contains a different type of execution plan.

  • Default Plan—The Default Plan tab displays the execution plan chosen by Oracle and is retrieved using the EXPLAIN PLAN statement. Click to retrieve the default plan after entering/importing the original SQL.
  • Actual Plan—The Actual Plan is retrieved from the plan cache after execution and is the actual execution plan performed by the database to execute the statement.

  • Virtual Plan—The Virtual Plan tab is displayed for indexes when you generate index alternatives in an Optimize SQL, SQL Rewrite session. See Fill Missing Execution Plans for more information about retrieving other execution plans for index alternatives.

Execution Plan Actions

Right-click in the Execution Plan window to select from the following actions:

Action

Description

Copy

Copies the execution plan to the clipboard.

Save

Saves the execution plan as a .jpg file. The DBMS_XPlan formats can be saved as a .txt file also.

Print

Opens the print window so you can print the execution plan.

View Plan

Allows you to change how the execution plan is displayed.

Step Description Select this option to display a description of the selected step in the Execution Plan pane footer.
Plan Information

If you select this option, SQL Optimizer identifies whether an execution plan uses any of the following: cardinality feedback, dynamic sampling, SQL plan directives, or adaptive plan. If applicable, the information displays in the Execution Plan pane directly above the Execution Plan tab.

Animate Plan Steps

Highlights, one-by-one, the execution plan steps.

Plan Options

Opens the Execution Plan Options window so you can select which information is displayed in the execution plan and whether to display specific items as a column.

Help on plan step

Displays the help text for the currently selected step in the execution plan.

Help on Execution Plan

Opens online help for the Execution Plan window.


Related Topics

Fill Missing Execution Plans

Copy Execution Plans

Review Execution Plans

SQL Optimizer provides a variety of formats for displaying an execution plan. After selecting a plan format, you can customize the plan display and the Execution Plan window.

To select a plan format

  1. Select a SQL statement.

  2. Right-click the execution plan and select View Plan | option.
  3. Select one of the following formats:

    • Tree Plan
    • DBMS_XPlan (Formatted)
    • DBMS_XPlan (Plain Text)
    • Graphic Plan
    • MS Graphic Plan
    • Plain Language Plan
  4. For more information about each format, review the following sections.

Plan Formats

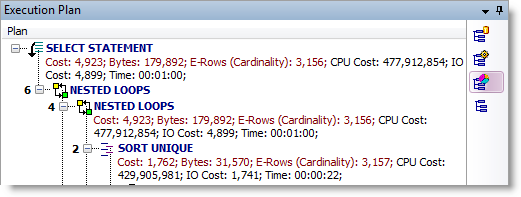
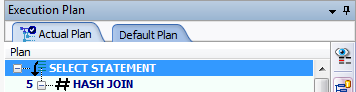
To use the Tree Plan

  1. Right-click an execution plan and select View Plan | As Tree Plan.

  2. Review the steps. The first line of the execution plan displays the SQL statement type, such as SELECT. The remaining lines represent an operation. The steps are numbered in the order of execution to make the plan easier to read.
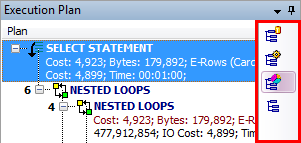
  3. Select a layout style for the tree plan from the Execution Plan toolbar (right panel). Each style displays different plan details (operators, predicates, statistics).

  4. To select which items/columns to display in the execution plan, right-click the plan and select Plan Options. The settings will apply to the current module only.

    • Select the items to include (such as cost, disk reads/writes).
    • Select which items to display as columns.
  5. To get additional Help on a step, select the step. Then right-click and select Help on plan step.
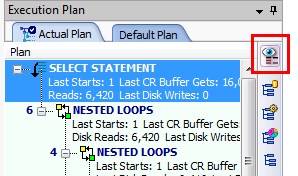
  6. In the Actual Plan tab, to display a comparison of Oracle estimates and actual statistics, click the Plan Comparison button in the Execution Plan toolbar.
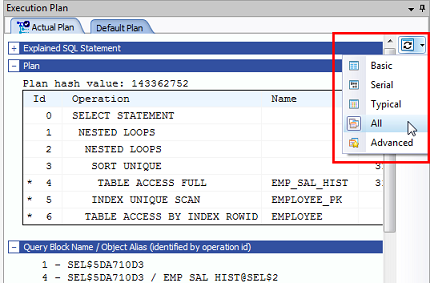
  7. To animate the steps, right-click the plan and select Animate Plan Steps.

To use DBMS_XPlan

  1. Right-click an execution plan and select View Plan | As DBMS_XPlan (Formatted) or DBMS_XPlan (Plain Text).
  2. The plan displays using DBMS_XPLAN.
  3. To select a display level for DBMS_XPlan (Formatted), click the arrow beside the Switch DBMS_XPlan level button and select an option.

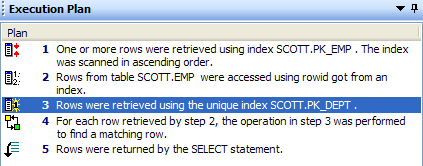
To use the Plain Language Plan

  1. Right-click an execution plan and select View Plan | As Plain Language Plan.
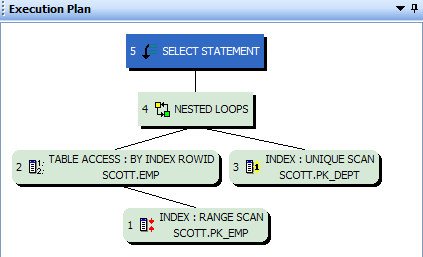
To use Graphic Plan

  1. Right-click an execution plan and select View Plan | As Graphic Plan.

  2. Hover over a step to display step details in a tooltip.
  3. To animate the steps, right-click the plan and select Animate Plan Steps.
  4. Right-click the plan and select Step Description to display the step description in plain language in the footer.
  5. To copy the plan as an image, right-click the plan and select Copy.

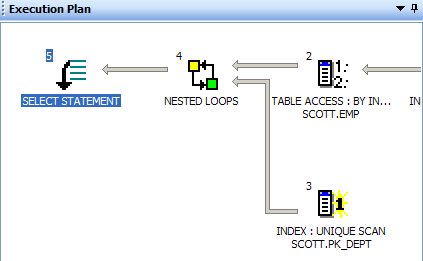
To use MS Graphic Plan

  1. Right-click an execution plan and select View Plan | As MS Graphic Plan.

  2. The available options are the same as the Graphic Plan.

To return to previous view

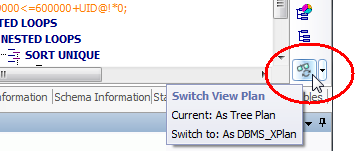
  • To return to your previous view, click the Switch View Plan button at the bottom of the Execution Plan toolbar. Use this button to easily toggle between two views. Click the arrow to select a different view.

Customize Tree Plan

To customize font style and color

  1. Go to Options | General | Execution Plan.
  2. You can customize text color and font style for each item in a plan. Settings apply to all Execution Plan panes. See Execution Plan Options for more information.
    • You can also specify warning thresholds for applying highlighting.

Customize Execution Plan Window

To display step description in footer

  • Right-click the plan and select Step Description. A description of the selected step displays in the footer of the Execution Plan pane. This is helpful when using one of the graphic displays.

To display additional plan information

  • Right-click the plan and select Plan Information to display additional information if the plan uses any of the following: cardinality feedback, dynamic sampling, SQL plan directives, or adaptive plan.


Related Topics

関連ドキュメント

The document was helpful.

評価を選択

I easily found the information I needed.

評価を選択