Tiles
|
1 |
|
3 |
Click Apply. |
|
1 |
Quick View
The Quick View consists of several views:
|
• |
Host List view: displays the list of objects associated with the selected domain. |
|
• |
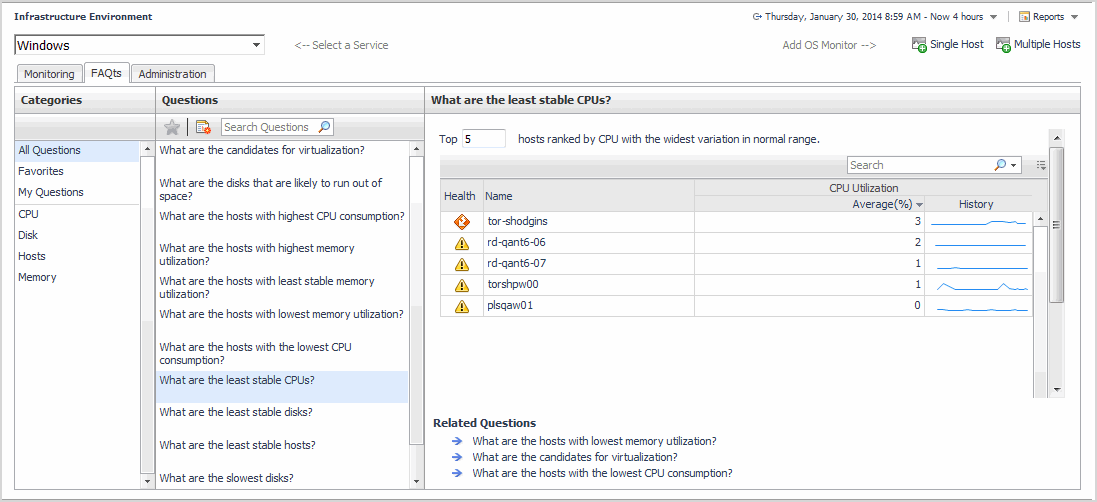
FAQts view (FAQ Mini Viewer): contains the list of questions relevant to the selected domain. |
|
• |
Domain Summary view: displays the utilization summary for all hosts monitored in the selected domain. |
|
• |
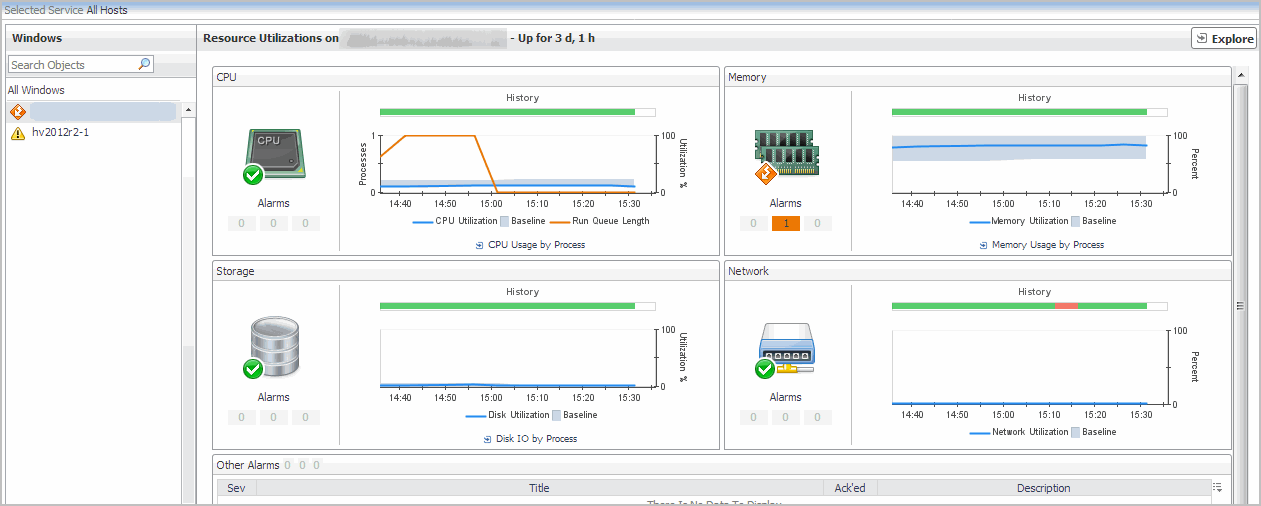
Resource Utilizations view: displays the resource utilization values for the selected monitored host. |
The Domain Summary view is the default view displayed when you select a tile in the Monitoring tab.
|
TIP: If the Resource Utilizations view is displayed for a selected monitored host, you can return to displaying the Domain Summary view by clicking All <Domain_Name> in the Host List view. |
At the top of the Domain Summary view, you can see information about the top resource users (that is, Top CPU Utilization, Top Network Utilization, Top Memory Utilization, and Top Disks Utilization). The number of top utilization indicators to be displayed in these charts and tables is defined by settings the monitoring agent properties. For more information, see Creating agent instances.
At the bottom of the view, you can see an embedded Alarms view, which displays the list of alarms fired for all hosts in the selected domain. To drill down into the Alarm view for a specific host, click the alarm status in the alarms table. This Alarm view shows the history of key metrics used in the rules that produced the alarm. You can click the various tabs to review additional diagnostic details, if required.
From the Domain Summary view, you can drill down into the All Hosts view by clicking the Explore button in the upper-right corner of the view.
|
• |
In the Host List view, click the name of the host. |
|
• |
If the host is not being monitored, the Resource Utilizations view displays a warning message. You can add the selected host to the list of monitored hosts by clicking Configure Host Monitoring |
|
• |
If the host is being monitored, the Resource Utilizations view shows the CPU, Memory, Network, and Storage utilization charts for the selected host, and the Other Alarms table (which displays all alarms on the selected host, other than CPU, Memory, Network, and Storage alarms). |
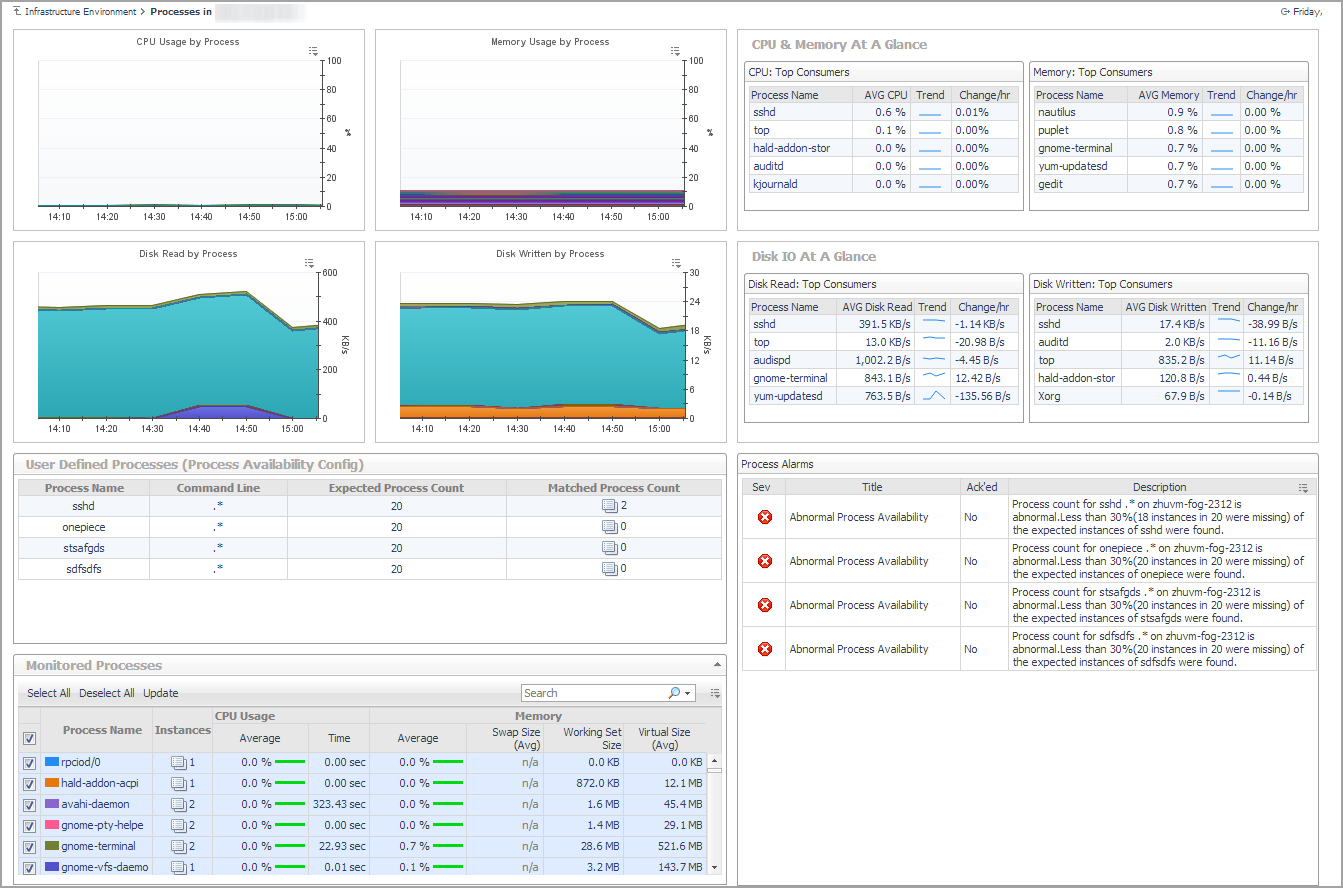
From the CPU, Memory, and Disk views you can drill down into the Processes dashboard, by clicking the CPU Usage by Process, Memory Usage by Process, and Disk IO by Process links respectively. The Processes dashboard provides a summary of CPU, memory, and disk usage by process, as well as a table of process details. If a host does not have process data (for example, because it is monitored by a virtual agent which does not collect process data), then it is possible to create an agent to monitor processes directly from this drill-down view.
|
NOTE: The drill-down mechanism may change in a future release when tab-based views are expected to become available under Explore. The Processes dashboard is moved from Foglight for Guest Process Investigation to Foglight for Infrastructure. In Foglight for Virtualization, Enterprise Edition, Foglight for Infrastructure is pre-installed and contributes a Processes tab to the VMware Explorer. This replaces the tab provided by Foglight for Guest Process Investigation in previous releases. To access this tab, on the navigation panel, under Dashboards, click VMware > VMware Explorer, and in the Virtual Infrastructure view, select a monitored ESX® host or a virtual machine. This feature allows you to monitor guest processes on virtual machines, and drill down into the processes running within virtual machines, to better understand internal performance and resource utilization. System administrators can use the Guest Processes Investigation views to quickly determine which processes are impacting VM or physical host performance and which VMs and physical hosts are utilizing resources ineffectively. If a host is not configured for monitoring, click the Add Monitoring button in the Processes tab to open the configuration wizard. For more information, see Adding a monitored host. |
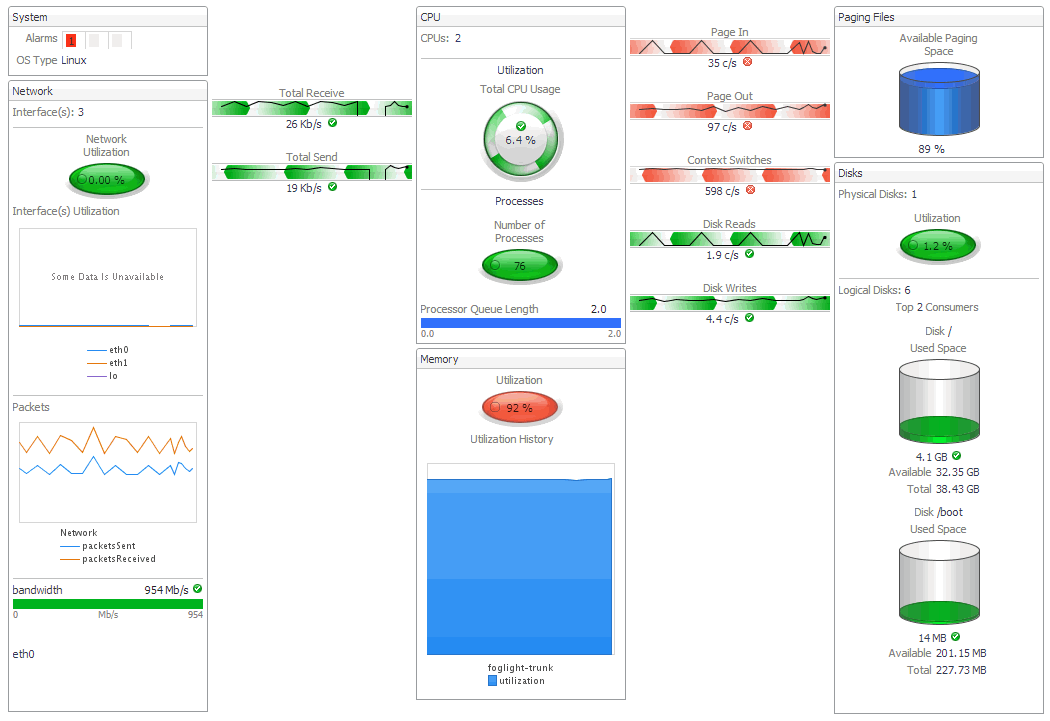
From the Resource Utilizations view you can drill down into the selected Host view by clicking the Explore button in the upper-right corner of the view. For more information, see Exploring monitored hosts.
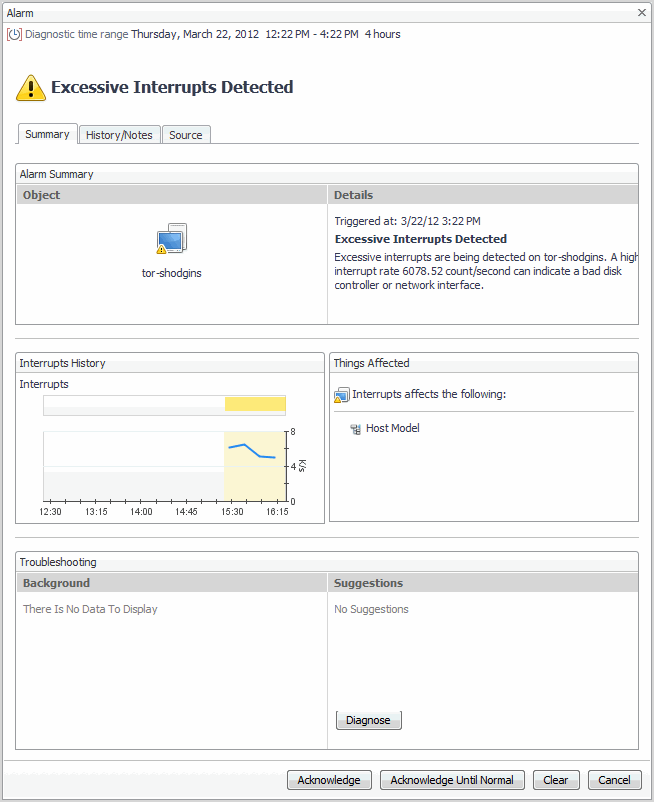
From the Resource Utilizations view for a monitored host you can drill down into more detailed alarm views, by clicking a specific alarm icon.
The Alarm view shows the history of key metrics used in the rules that produced the alarm. You can click the various tabs to review additional diagnostic details, if required.
Exploring monitored hosts
When you select a monitored host and display its resource utilization views in the Quick View, you can drill down to a detailed view to explore that host’s activity. For example, selecting a Windows® host and choosing Explore displays a monitoring dashboard that helps you understand the state of the host’s resources and how they affect your monitored system as a whole. Along with displaying the system, network, CPU, memory, disk usage metrics, and any related alarms, this intuitive dashboard connects these visual elements with a series of graphical flows that illustrate how quickly the hosts transmits and processes data in real time. For example, you can review the rates of incoming and outgoing data and how they affect your network resources.
For complete information about the views and metrics appearing on this dashboard, see Host Monitor views.
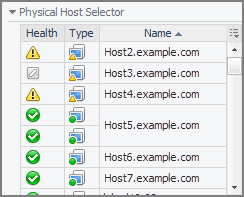
This dashboard also provides the Physical Host Selector on the navigation panel, which allows you to quickly drill down on a different host and investigate its state, without returning to the Quick View.
|
3 |
|
4 |
Optional. Drill down on a different host. On the navigation panel, under Physical Host Selector, click a host. |
Exploring the FAQ Question Viewer
This tab is made up of the following embedded views:
|
• |

