サポートと今すぐチャット
サポートとのチャット

Foglight for Infrastructure 5.9.3 - User Guide

Using Foglight for Infrastructure Monitoring log files with Foglight Log Monitor Monitoring IBM PowerVM environments
Before you begin Managing PowerVM HMC agents Monitoring your PowerVM environment
Advanced system configuration and troubleshooting Reference
Foglight for Infrastructure views Foglight Log Monitor views Rules Metrics
Appendix: Building regular expressions in Foglight

Identifying top consumers of PowerVM partition resources

A PowerVM® partition encapsulates operating system and application components. It runs inside a physical server and is dedicated a share of its physical resources. PowerVM partitions are managed by the PowerVM Hypervisor software. You can monitor the performance of PowerVM partitions when you select the Partition tile on the Infrastructure Environment dashboard.

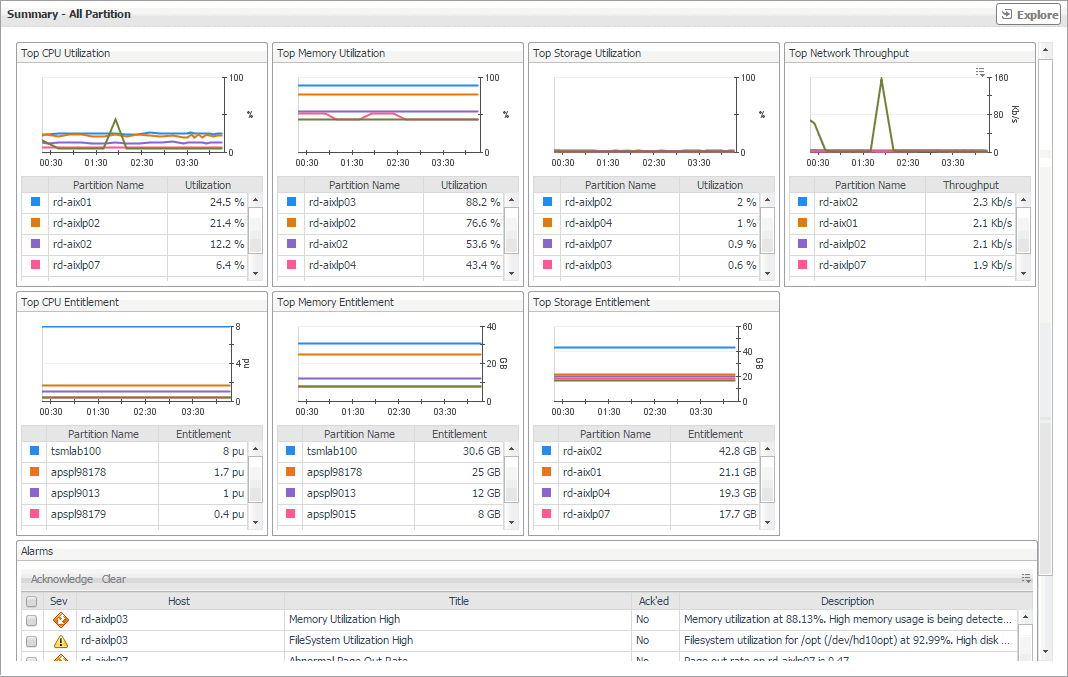
The Summary - All Partition view identifies five partitions with the highest processor, memory, and disk entitlement, the highest processor, memory, and disk utilization, and the highest network throughput. This view appears in the Selected Service PowerVM view when you select All Partition in the Partition view on the left. Use it to quickly locate a PowerVM partition system with available resources that can be put to specific use in your integrated environment.

Figure 21. Summary - All Partition view

Top CPU Utilization

The PowerVM partitions consuming the most of the processor resources allocated to them.


%

The percentage of all processing units that are allocated to the PowerVM partition and are in use over the selected time range.


Partition Name

The PowerVM partition name.


Utilization

The percentage of all processing units that are allocated to the PowerVM partition and are currently in use.

Top Memory Utilization

The PowerVM partitions consuming the most of the memory resources allocated to them.


%

The percentage of memory resources that is allocated to the PowerVM partition and is in use over the selected time range.


Partition Name

The PowerVM partition name.


Utilization

The percentage of the memory resources that is allocated to the PowerVM partition and is currently in use.

Top Storage Utilization

The PowerVM partitions consuming the most of the disk space allocated to them.


%

The percentage of disk space that is allocated to the PowerVM partition and is in use over the selected time range.


Partition Name

The PowerVM partition name.


Utilization

The percentage of the memory resources that is allocated to the PowerVM partition and is currently in use.

Top Network Throughput

The PowerVM partitions with the highest network throughput.


b/s

The rate at which the PowerVM partition transfers data to or from the network during the selected time range.


Partition Name

The PowerVM partition name.


Throughput

The current rate at which the PowerVM partition transfers data to or from the network.

Top CPU Entitlement

The PowerVM partitions with the highest numbers of allocated processing units.


pu

The number of processing units allocated to the PowerVM partition over the selected time range.


Partition Name

The PowerVM partition name.


Entitlement

The number of processing units allocated to the PowerVM partition.

Top Memory Entitlement

The PowerVM partitions with the highest amounts of allocated memory resources.


GB/MB

The amount of memory allocated to the PowerVM partition over the selected time range.


Partition Name

The PowerVM partition name.


Entitlement

The amount of memory allocated to the PowerVM partition.

Top Storage Entitlement

The PowerVM partitions with the highest amounts of allocated disk space.


GB/MB

The amount of disk space allocated to the PowerVM partition over the selected time range.


Partition Name

The PowerVM partition name.


Entitlement

The amount of disk space allocated to the PowerVM partition.

Alarms

For more information, see Observing alarms.

Viewing individual PowerVM partition details

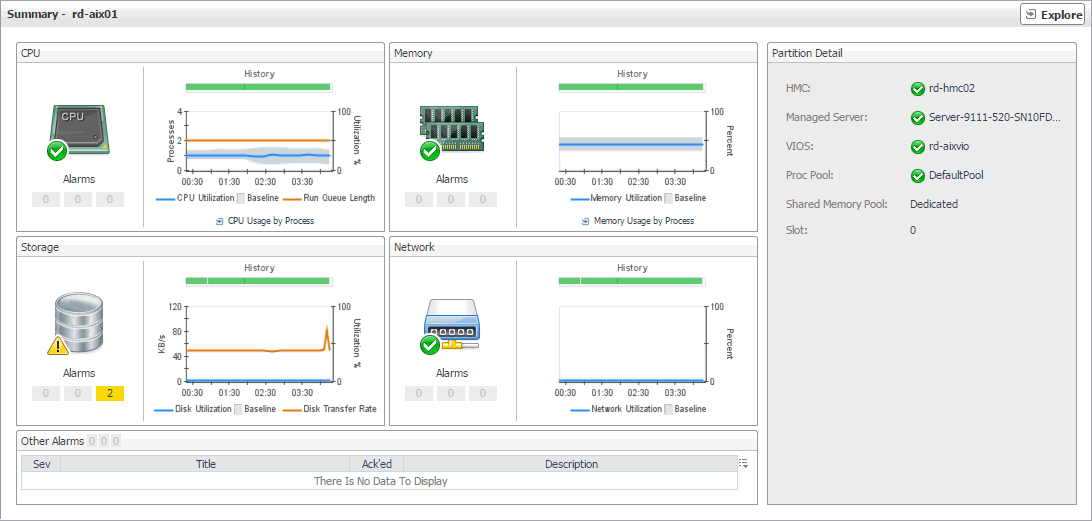
The PowerVM® Partition Summary view displays the resource utilization for the selected partition. This view shows the levels of processor, memory, disk, and network usage. It also identifies the elements of your PowerVM infrastructure associated with the selected PowerVM partition, such as the HMC, managed server, VIOS, and others. This view appears in the Selected Service PowerVM view when you select the Partition tile, and a PowerVM partition in the Selected Service PowerVM view, on the left.

Use this view to review the trends in usage of the partition's system resources, and to review any generated alarms, if they exist. For example, high peaks in the processor usage chart could cause performance degradation and should be investigated.

CPU


Alarm state

The alarm state of the processor resources allocated to the PowerVM partition.


Alarms

The counts of alarms generated against the processor resources allocated to the PowerVM partition, given for each severity state: Warning, Critical, and Fatal.


History

A color-coded bar, representing the alarm state of the processor resources allocated to the PowerVM partition over the selected time range. The color of the bar changes depending on the alarm state. Red indicates a Fatal state, orange indicates Critical, yellow means Warning, and green is the Normal State.


CPU Utilization

The percentage of all processing units that are allocated to the PowerVM partition and are currently in use.


Baseline

An envelope indicating the expected processor utilization range based on historical data.


Run Queue Length

The number of processes that are either running or waiting in the queue. A high number of processes in the run queue means the processor is busy. A consistently high number can indicate that the PowerVM partition needs additional processor resources.


CPU Usage by Process

Click this link to display the Processes dashboard and find out more about the processor and memory usage by each process running on this PowerVM partition. For more information about this dashboard, see the Foglight™ for Infrastructure User and Reference Guide.

Memory


Alarm state

The alarm state of the memory resources allocated to the PowerVM partition.


Alarms

The counts of alarms generated against the memory resources allocated to the PowerVM partition, given for each severity state: Warning, Critical, and Fatal.


History

A color-coded bar, representing the alarm state of the memory resources allocated to the PowerVM partition over the selected time range. The color of the bar changes depending on the alarm state. Red indicates a Fatal state, orange indicates Critical, yellow means Warning, and green is the Normal State.


Memory Utilization

The percentage of all memory resources that are allocated to the PowerVM partition and are currently in use.


Baseline

An envelope indicating the expected memory utilization range based on historical data.


Memory Usage by Process

Click this link to display the Processes dashboard and find out more about the processor and memory usage by each process running on this PowerVM partition. For more information about this dashboard, see the Foglight for Infrastructure User and Reference Guide.

Storage


Alarm state

The alarm state of the disk resources allocated to the PowerVM partition.


Alarms

The counts of alarms generated against the disk resources allocated to the PowerVM partition, given for each severity state: Warning, Critical, and Fatal.


History

A color-coded bar, representing the alarm state of the disk resources allocated to the PowerVM partition over the selected time range. The color of the bar changes depending on the alarm state. Red indicates a Fatal state, orange indicates Critical, yellow means Warning, and green is the Normal State.


Disk Utilization

The percentage of all disk resources that are allocated to the PowerVM partition and are currently in use.


Baseline

An envelope indicating the expected disk utilization range based on historical data.


Disk Transfer Rate

The current rate at which the PowerVM partition transfers data to or from the disk.

Network


Alarm state

The alarm state of the network interfaces allocated to the PowerVM partition.


Alarms

The counts of alarms generated against the network interfaces allocated to the PowerVM partition, given for each severity state: Warning, Critical, and Fatal.


History

A color-coded bar, representing the alarm state of the network interfaces allocated to the PowerVM partition over the selected time range. The color of the bar changes depending on the alarm state. Red indicates a Fatal state, orange indicates Critical, yellow means Warning, and green is the Normal State.


Network Utilization

The percentage of the network resources that are allocated to the PowerVM partition and are currently in use.


Baseline

An envelope indicating the expected network utilization range based on historical data.

Related Info


HMC

The name of the HMC to which the PowerVM partition belongs, preceded by its alarm state: Normal , Warning , Critical , or Fatal .


Managed Server

The name of the managed server associated with this PowerVM partition, preceded by its alarm state: Normal , Warning , Critical , or Fatal .


VIOS

The name of the virtual I/O server associated with this PowerVM partition, preceded by its alarm state: Normal , Warning , Critical , or Fatal .


Proc Pool

The name of the processor pool associated with this PowerVM partition, preceded by its alarm state: Normal , Warning , Critical , or Fatal .


Shared Memory Pool

The name of the global memory pool associated with this PowerVM partition, preceded by its alarm state: Normal , Warning , Critical , or Fatal .


Slot

The slot number dedicated to the PowerVM partition in your monitored system.

Other Alarms

For more information, see Observing alarms.

Identifying top consumers of PowerVM virtual I/O server resources

A PowerVM® Virtual I/O Server (VIOS) enables logical partitions to share physical resources of a managed server among multiple PowerVM partitions. It can provide virtualized storage along with network adapters, allowing you to facilitate the LAN and disk resources. You can monitor the performance of VIOS instances when you select the VIOS tile on the Infrastructure Environment dashboard.

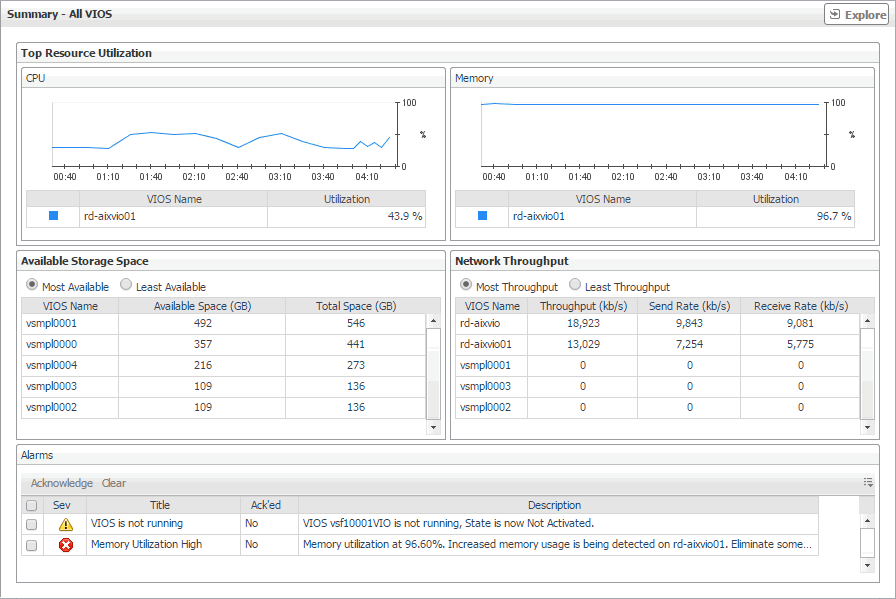
The Summary - All VIOS view identifies five servers with the highest processor and memory utilization, and the most or least available storage space, and the most or least network throughput. This view appears in the Selected Service PowerVM view when you select All VIOS in the VIOS view on the left. Use it to quickly locate a VIOS with available resources that can be put to better use in your integrated environment.

Figure 23. Summary - All VIOS view

Top Resource Utilization


CPU

The VIOS instances with the highest utilization of allocated processor resources.


%

The percentage of the processor resources allocated to the VIOS that are in use over the selected time range.


VIOS Name

The VIOS name.


Utilization

The percentage of the allocated processor resources that are currently in use by the VIOS.


Memory

The VIOS instances with the highest utilization of allocated memory resources.


%

The percentage of the memory resources allocated to the VIOS that are in use over the selected time range.


VIOS Name

The VIOS name.


Utilization

The percentage of the allocated VIOS memory resources that are currently in use.

Available Storage Space


Most Available

Select this option to sort the VIOS instances by the most available disk space.


Least Available

Select this option to sort the VIOS instances by the least available disk space.


VIOS Name

The VIOS name.


Available Space (GB)

The amount of disk space allocated to the VIOS that is available for use.


Total Space (GB)

The total amount of disk space allocated to the PowerVM VIOS.

Network Throughput


Most Throughput

Select this option to sort the VIOS instances by the highest network throughput.


Least Throughput

Select this option to sort the VIOS instances by the lowest network throughput.


VIOS Name

The VIOS name.


Throughput (kb/s)

The current rate at which the VIOS transfers data to or from the network.


Send Rate (kb/s)

The current rate at which the VIOS transfers data to the network.


Receive Rate (kb/s)

The current rate at which the VIOS transfers data from the network.

Alarms

For more information, see Observing alarms.

Viewing individual PowerVM VIOS details

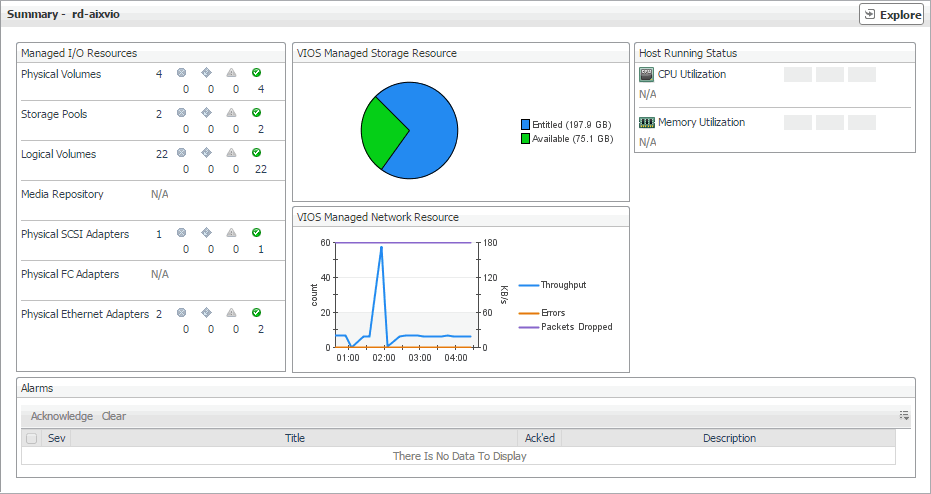
The VIOS Summary view displays the resource utilization for the selected PowerVM® VIOS. This view identifies the resource components managed by this VIOS, the levels of available and assigned disk resources, the network throughput rate and numbers of errors and dropped packets over the selected time range, and the trends in the host processor and memory utilization.

This view appears in the Selected Service PowerVM view when you select the VIOS tile, and then click a VIOS in the VIOS view on the left. Use it to review the trends in usage of the resources managed by the selected PowerVM VIOS, and to review any generated alarms, if they exist. For example, high peaks in the VIOS Managed Network Resource chart could indicate performance degradation and should be investigated.

Managed I/O Resources


Physical Volumes

The number of physical disks available to the PowerVM virtual I/O server, followed by the numbers of physical disks in each severity state: Normal , Warning , Critical , and Fatal .


Storage Pools

The number of storage pools available to the PowerVM virtual I/O server, followed by the numbers of storage pools in each severity state: Normal , Warning , Critical , and Fatal .


Logical Volumes

The number of logical disks available to the PowerVM virtual I/O server, followed by the numbers of logical disks in each severity state: Normal , Warning , Critical , and Fatal .


Media Repository

The number of media repositories available to the PowerVM virtual I/O server, followed by the numbers of media repositories in each severity state: Normal , Warning , Critical , and Fatal .


Physical SCSI Adapter

The number of physical SCSI (Small Computer System Interface) adapters available to the PowerVM virtual I/O server, followed by the numbers of physical SCSI adapters in each severity state: Normal , Warning , Critical , and Fatal .


Physical FC Adapter

The number of physical FC (fiber channel) adapters available to the PowerVM virtual I/O server, followed by the numbers of adapters in each severity state: Normal , Warning , Critical , and Fatal .


Physical Ethernet Adapter

The number of physical Ethernet adapters available to the PowerVM virtual I/O server, followed by the numbers of adapters in each severity state: Normal , Warning , Critical , and Fatal .

VIOS Managed Storage Resource


Entitled

The amount of disk space that is managed by the PowerVM VIOS.


Available

The amount of disk space that is managed by the PowerVM VIOS, and is available for entitlement to the associated PowerVM partitions, or for its own use.

VIOS Managed Network Resource


Throughput

The rate at which the PowerVM VIOS transfers data to and from the network during the selected time range.


Errors

The rate at which the PowerVM VIOS encounters errors while transferring data to and from the network during the selected time range.


Packets Dropped

The rate at which the PowerVM VIOS drops data packets while transferring data to and from the network during the selected time range. By default, network adapters send or receive multiple data packets in a single request. When data packets are dropped before reaching their destinations, this may indicate a problem with the network connection or the network adapters.

Host Running Status


CPU Utilization

The percentage of the allocated processor resources that the host associated with the PowerVM VIOS currently uses.


Memory Utilization

The percentage of the allocated memory resources that the host associated with the PowerVM VIOS currently uses.

Alarms

For more information, see Observing alarms.

関連ドキュメント

The document was helpful.

評価を選択

I easily found the information I needed.

評価を選択