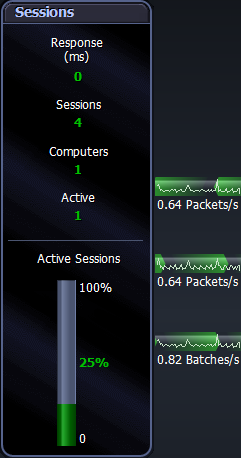
The Sessions panel shows the following information:
|
|
|
This shows the full round-trip response time (in milliseconds) of a query representative of general workload (select 1, by default). Tip: To change the query used to determine response time, right click a connection in the Spotlight Browser and then select Properties. On the Monitoring page, click SQL Server Response Time. Only members of the Spotlight Diagnostic Administrators group can change the SQL Statement used to measure SQL Server response time. See "SQL Server Response Time Dialog" (page 1) for more information. Shows the number of SQL Server user (non-system) sessions, excluding SQL Server Agent sessions. Shows the number of client computers that currently have at least one SQL Server session. Shows the number of non-system sessions that are actively processing in SQL Server, or are waiting on locks (blocked). Shows the percentage of non-system SQL Server sessions that are active (executing), or waiting on locks (blocked). This flow from the SQL Processes panel to the Sessions panel represents the rate at which network packets are being sent from SQL Server to client applications. This flow from the Sessions panel to the SQL Processes panel represents the rate at which network packets are being received by SQL Server from client applications. This flow from the Sessions panel to the SQL Processes panel shows the rate at which Batches of SQL statements are being submitted to SQL Server for execution. |

 Response