Monitoring Virtual Machines
Virtual machines share many of the characteristics of physical systems (like storage and network interaction), but they do not have direct access to the hardware that is used to process. Each virtual machine runs on a guest operating system (for example, Microsoft® Windows® XP), and is allocated access to a specific set of the server’s resources. This includes the number of processors and the amount of memory it can leverage.
|
1 |
|
2 |
Exploring the Collective Use of All Virtual Machine Resources
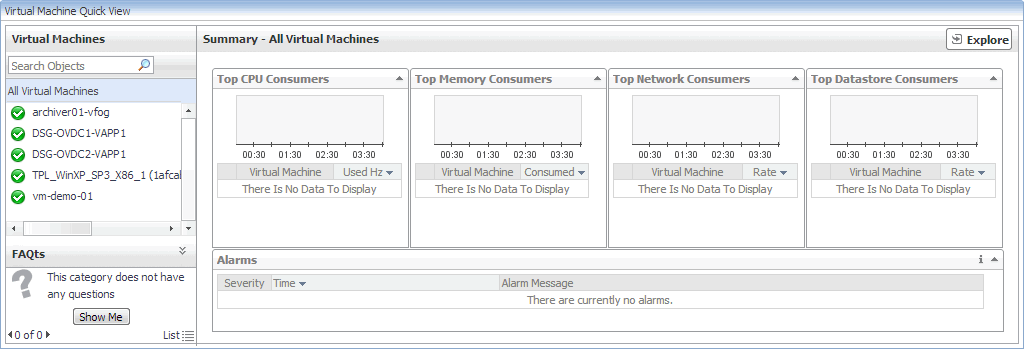
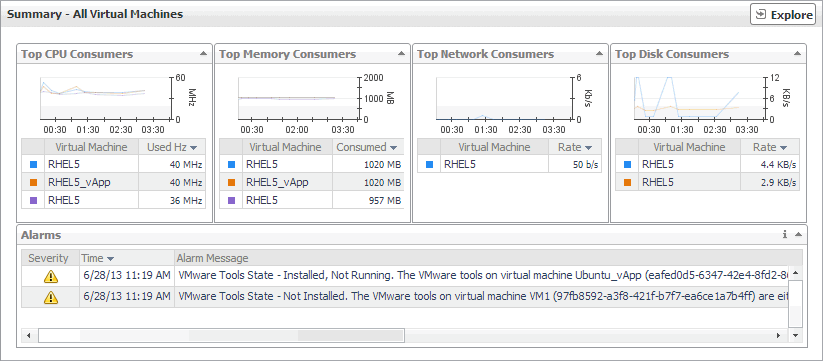
The Summary - All Virtual Machines view displays the levels of resource utilization for all virtual machines, broken down into four simple views. This view identifies the virtual machines that consume the highest amount of system resources. It can help you learn about the resource levels used by all virtual machines, and to identify and prevent potential bottlenecks by reallocating resources where they are most needed.
This summary view appears on the right of the Quick View when you select the Virtual Machines tile.
The information appearing on this view is organized into four views: Top CPU, Memory, Network, and Datastore Consumers views.
For information about the All Alarms view also appearing in this summary, see Managing Alarms .
Top CPU, Memory, Network, and Datastore Consumers views
Foglight™ for vCloud Director populates these views using the metrics collected by Foglight for VMware. For more information about the metrics appearing in these views, see the Managing Virtualized Environments User and Reference Guide.
|
The amount of memory the virtual machine consumes during the selected time range. | |
Exploring the Use of Individual Virtual Machine Resources
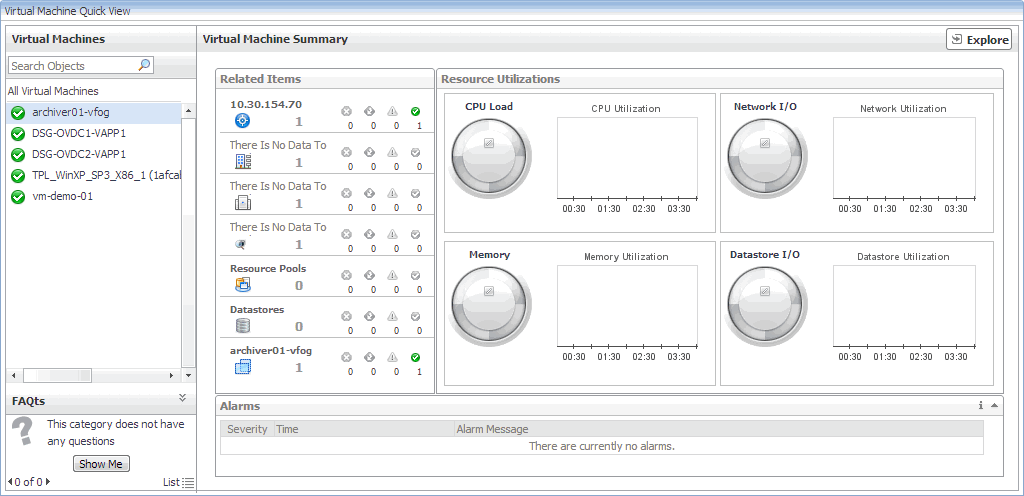
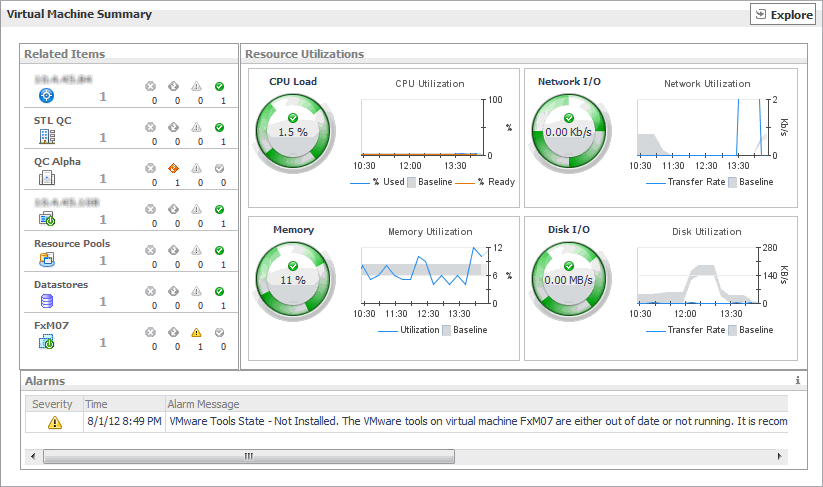
The Virtual Machine Summary view displays the amounts of system resource consumption for a selected virtual machine. This view can help you to identify and prevent potential bottlenecks by reallocating resources where they are most needed. It appears on the right in the Quick View when you select a virtual machine in the Virtual Machines pane.
The information appearing on this view is displayed in the Resource Utilizations view.
For information about the Related Items and All Alarms views also appearing in this summary, see the following :


