|
The user name required for connecting to the database, if the Windows_Default_Account authentication type was selected. | |
|
1 |
|
2 |
Click Create Agent. |
|
3 |
Select the agent type DB_SQL_Server_Concentrator. |
|
5 |
Click Create. |
|
2 |
Click Edit Properties. |
|
3 |
Click Modify properties for this agent only. |
|
6 |
Click Edit to edit the list of downstream Agent Managers. |
|
7 |
Click Add Row. |
|
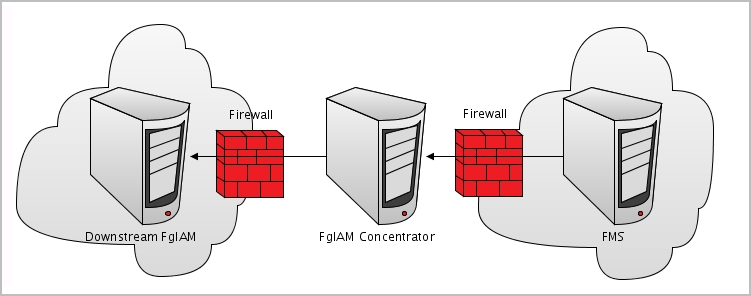
IMPORTANT: When editing the properties of the Foglight Agent Manager concentrator (Dashboards > Administration > Agents > Agent Status), the name of the Foglight Agent Manager should be entered in the Downstream FglAMs section exactly as it appears in the topology, under Home > Agents > All agents > <Agent name> > RMI data > FglAM host property. The <Agent name> parameter refers to the Foglight for SQL Server agents that reside on the selected Foglight Agent Manager. |
|
10 |
Click Save Changes. |
|
11 |
Click Save at the lower right corner of the screen. |
|
12 |
Click Back to Agent Status. |
|
14 |
Click Activate. |
|
15 |
Click OK to complete the process. |
|
2 |
On the navigation panel, click Homes > Databases. |
|
• |
Status summary — a color-coded bar, which provides a visual representation of the summarized health condition of all instances listed in the Database Group table. |
|
• |
Database-specific health summary — when the database group All is selected, this section displays all the currently monitored instances for each database type, divided by their health state (for example: four SQL Server instances, three of which have the health state Warning and one is indicated with the health state Fatal). When a user-defined database group is selected, this section displays data only about the agents included within the selected group. |
|
• |
The Monitor button — Use this button to add instances to monitor. For details, see Monitoring Data Replication. |
|
• |
The Configure Alarms button — Takes you directly to the Administration > Alarms page. On the Alarms page you can configure alarm settings and specify alarm sensitivity levels. Sensitivity levels control which alarms are enabled by default. |
|
• |
The Settings button — Use this button to do one of the following: |
|
• |
|
• |
Currently selected database group table — a list of all monitored databases within the database group that is selected in the Databases section. For details, see Currently Selected Database Group. |
|
• |
The Select dashboards ( |
