|
IMPORTANT: To create a custom filter for this table, use the options accessible by clicking the Customizer button at the table’s upper right side. For details, see Components Shared by all Foglight for SQL Server Screens. |
|
NOTE: To define global settings about data retrieval to the Buffer Cache table panel, use the Buffer Cache view in the Databases Administration dashboard. To access this view, click the In-context actions button at the upper right side of the screen and then select Agent settings. For details, see Setting Options for Displaying Data in the Buffer Cache. |
|
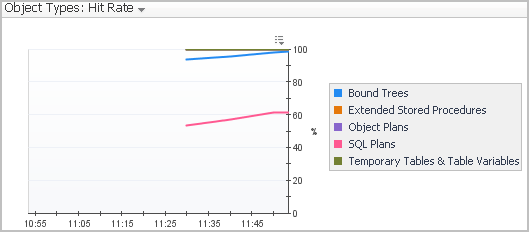
• |
Bound Trees — normalized trees for views, rules, computed columns, and check constraints. For details, see glossary definition of Bound trees. |
|
• |
Extended Stored Procedures — a SQL Server object that dynamically loads and runs a function within a dynamic-link library (DLL) in a manner similar to a stored procedure. For details, see glossary definition of Extended stored procedures. |
|
• |
Object Plans — query plans generated by creating a stored procedure, function, or trigger. For details, see glossary definition of Object plans. |
|
• |
Replication Procedure Plans — query plans of a replication system stored procedure. For details, see glossary definition of Replication procedure plans. |
|
• |
|
• |
Temporary Tables and Table Variables — temporary tables are session-specific tables, that is, the tables are automatically dropped when the session is closed. Table variables, on the other hand, are created in the memory and exist there until the running of a single Transact-SQL (T-SQL) batch is completed. For details, see glossary definition of Temporary tables and table variables. |
|
NOTE: To define global settings about data retrieval to the Plan Cache table, use the Plan Cache view in the Databases Administration dashboard. To access this view, click the In-context actions button at the upper right side of the screen and then select Agent settings. For details, see Setting Options for Displaying Data in the Plan Cache. |
| |||||||||||
|
• |
An overview of the activity in the currently monitored database, using the SQL Instance Summary panel. |
|
• |
Viewing SQL I/O activity data — using the SQL I/O Activity panel, which provides graphical representations of various I/O activities of the currently diagnosed SQL Server instance. For details, see Viewing SQL I/O Activity Data. |
|
• |
Viewing session data — using the Sessions panel, which lists all current SQL sessions and allows viewing session details and locks. For details, see Reviewing Session Details. |
|
• |
Viewing detailed statistics about locks and latches — using the Locks panel, which displays information about all locks, latches and requests on the currently diagnosed SQL Server instance. For details, see Monitoring Locks and Latches. |
|
• |
Viewing statistics about current lock conflicts — using the Blocking (Current) panel, which displays information about all current blocked sessions and lock conflicts, including the connections and resources involved in these conflicts. For details, see Tracking Current Lock Conflicts. |
|
• |
Tracking deadlocks and their implications — using the Deadlocks panel, which displays all of the deadlocks that took place within the selected time range, as well as the databases and objects that were involved in the deadlock situations. For details, see Tracking Deadlocks and their Affected Objects. |
|
• |
Viewing I/O Statistics by Database Files — using the I/O by File panel, which displays current I/O statistics for each SQL Server file. For details, see Viewing I/O Statistics by Database Files. |
|
• |
|
1 |
|
2 |
Click the requested session in the Sessions table. |
|
3 |
Review the details displayed in the Session Details pane. |
|
1 |
|
2 |
View the details displayed in the IO by File table. |

|
• |
Buffer Cache — the hit rate for this cache should normally be over 90%. |
|
• |
Procedure Cache — the hit rate for this cache varies widely, depending on how well the application is written. |
|
• |
|
• |
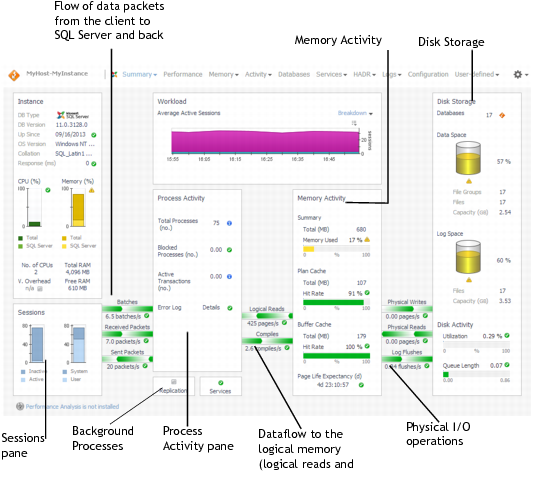
Components representing instance data flow — the main activity area in the Foglight for SQL Server Instance Homepage includes several panes and flows that represent the data flow in the SQL Server operation. The dataflow is described in this guide as a top-down design, that is: from the session to the physical disk storage. See Tracking the Instance Data Flow. |
|
• |
Up Since — identifies the date and time when the instance was last started. |
|
• |
|
When this icon is yellow, clicking it displays text that describes theBlocking Alarm deviations that triggered this display, along with a representation of the rate at which SQL Server is encountering network packet errors. | |
|
When scanning is enabled, Foglight for SQL Server scans the SQL Server logs and raises alarms upon finding error messages that contain any of the error log alert rules. These rules can be specified for all connections, or for the current connection, using the Log Scanning view in the Databases Administration dashboard. For details, see Defining Error Log Filtering.
|
 | |
 | |
|
• |
Checkpoint Writes are the most common type of write activity under normal circumstances. The checkpoint process periodically scans the buffer cache for modified pages and flushes all modified pages out to disk, thereby minimizing the amount of work SQL Server is required to do on restart. |
|
• |
Lazy Writer Writes are carried out when the Lazy Writer process needs to free up buffer pages that have been modified in the buffer cache. Freeing up the buffers requires the Lazy Writer process to write first the changed pages to disk. |
|
• |
Physical Page Reads are carried out when a user connection requests a page that is not already in the buffer cache. The connection requesting the page awaits until the I/O operation completes. |
|
• |
Physical Page Writes are write operations where the user connection has to wait for the I/O to complete before continuing. These are most often caused by operations such as create index, bulk insert, or restore. |
|
• |
Read Ahead occurs when SQL Server forecasts the need for data that currently resides on the disk. In this case, the pages are pre-fetched into the buffer cache before being requested by the user, using Read Ahead processing. |
|
When a row in a table that does not have a clustering index is updated - and if the modified row no longer fits on the old page - SQL Server moves the row to a new page and leaves a forwarding pointer in the old page.
| |
|
The rate at which SQL Server encounters ghosted records during scans. When a record is deleted from a table, SQL Server improves concurrency by not physically removing the row from index Leaf levels, but marking it instead as deleted (ghosted).
| |
|
• |
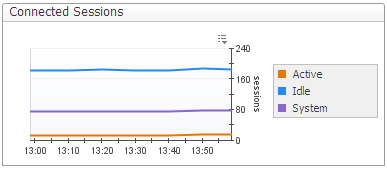
Sessions — Displays the distribution of the currently opened SQL Server sessions between active (sessions that are actively processing in SQL Server) and inactive sessions during the current sampling period. |
|
• |
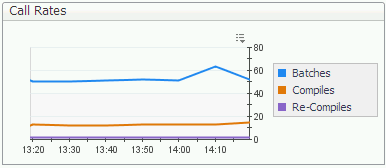
Throughput — Divided to 3 metrics which represent the throughput of the monitored instance: |
|
• |
Blocked — Displays the total number of SQL Server sessions that are blocked during the current sampling period. |
|
• |
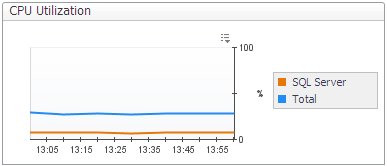
CPU — The Host CPU Usage the total percentage of CPU resources being used on the monitored host. The displayed value represents the total CPU that is consumed by all Windows processes (SQL Server and non-SQL Server processes). |
|
• |
|
Allows termination of the selected session, using the Kill Session dialog box that is displayed upon clicking this column. | |
|
The number of open transactions. This parameter’s value corresponds to the value of the session’s @@trancount — a global variable that reflects the level of nested transactions. | |
|
• |
Waits — the rate of lock request wait events. Such wait events take place when lock requests cannot be satisfied immediately and require the caller to wait before being granted the lock. |
|
• |
Average Wait Time — the average time (in seconds) that elapses before a lock request wait is cleared. |
|
• |
Lock Requests — the number of lock requests and lock conversion requests per second. |
|
• |
Timeouts — the number of lock time-outs per second. |
|
• |
Deadlocks — the number of lock requests per second that resulted in a deadlock. |
|
• |
Latch Waits — how many wait events for latches occurred in the specified time range |
|
• |
Total Wait Time — the total amount of time (in milliseconds) that latch requests spent waiting during the specified time range |
|
• |
|
• |
Monitoring the processes blocked during the reporting period, using the Number of Blocked Processes chart. For details, see Monitoring blocked processes for the sampled interval. |
|
• |
Blocked Processes — number of sessions that were waiting on locks held by others. |
|
• |
Lead Blockers — number of sessions that were not blocked, but were blocking others. Lead Blockers correspond to sessions in the Blocking table that do not have a parent in the Blocking chain (at level 1 in the tree). |
|
• |
|
• |
|
• |
|
• |
