|
Figure 109. Top Application Consumers view
 | |
|
Figure 110. Top Desktop Consumers view
 | |
|
Figure 111. Top Session Logon Duration view
 | |
|
Figure 112. Top Session Network Latency
 |

|
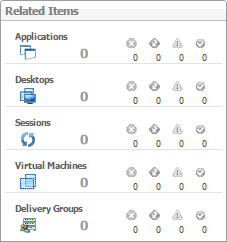
Figure 114. Related Items view
 | |
|
Figure 115. Top App CPU Consumers view
 | |
|
Figure 116. Top App Memory Consumers view
 | |
|
Figure 117. Top Session Latency view
 | |
|
Figure 118. Top Desktop CPU Consumers view
 | |
|
Figure 119. Top Desktop Memory Consumers view
 | |
|
Figure 120. Top Session Transfer Rate view
 | |
|
Figure 121. Sessions view
|
|
1 |
|
2 |
|
3 |
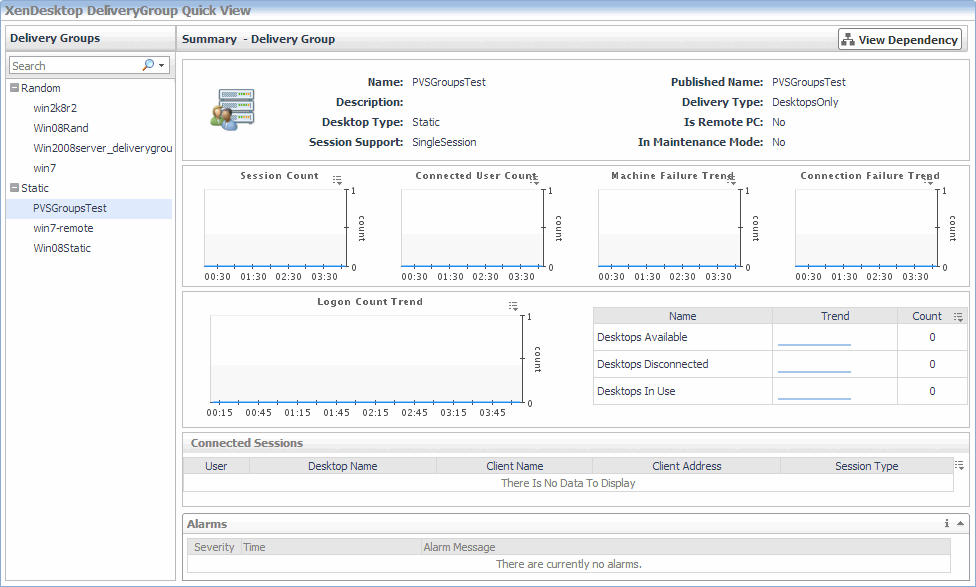
In the XenDesktop DeliveryGroup Quick View, in the Delivery Groups view on the left, click a delivery group node. |
|
4 |


|
Figure 126. General information
 | |
|
Figure 127. Session Count, Connected User Count, Machine Failure Trend, and Connection Failure Trend views
 | |
|
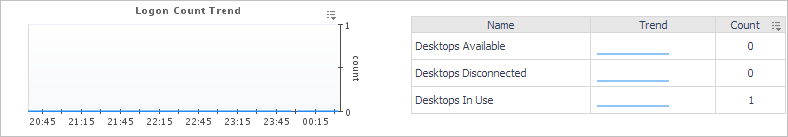
Figure 128. Logon Count Trend view
 | |
|
Figure 129. Sessions view
| |
|
Figure 130. Alarms view
 |
