The Progress and Performance Dashboard provides an administrator with an overview of the current state of the archive migration project. The following information is displayed:
|
Item |
Description |
|---|---|
|
Status |
User finished migration: Percentage of mapped containers that have been through the complete workflow Stage 1 (Synced): Percentage of users that have been synched. Stage 2 (Switched): Percentage of enabled users switched to target |
|
Basic statistics |
Data gathered for the migration, including: Users Total number of users Mailboxes Total number of mailboxes Archives Total number of archives Archived Items Total number of archived items Archived Items Size Size Total size of the archived items Mappings Total number of containers that have been mapped Enabled for Sync (Stage 1) Total number of containers that are in Stage 1 Enabled for Switch (Stage 2) Total number of containers that are in Stage 2 Finished Migration Total number of containers that have finished migration |
|
Last 10 Workflow Completed Users |
Last ten users that have fully completed their migration workflow Clicking in this area will move you to the Stage 2 screen within the Admin Interface. |
|
Export Speed GB/h Extraction Speed Items/h Ingestion Speed GB/h Ingestion Speed Items/h |
Export and import speed per hour, calculated from the last ten minutes values |
|
Overall Performance |
Collection, Export and Import performance broken down into a timetable. ·Last ten minutes ·Last hour ·Current day ·Current week ·Current month ·Current quarter ·Last 6 months ·Current year ·All |
|
Archive Statistics |
For how many archive have archive statistics been received. Archive statistics are: ·Count of items in an archive ·Size of items in an archive ·Count of shortcuts in mailbox belonging to this archive |
|
Collected Items |
How many items need to be collected in total (based on archive statistics), and how many have already been collected. |
|
Current Activity |
·Running Export Item Count ·Running Imports Item Count ·Failed Export item Count ·Failed Import Item Count ·Running Export Item Size ·Running Import Item Size ·Failed Export Item Size · Failed Import Item Size |
|
Exported Items Exported Size Imported Items Imported Size |
Exported and imported count/size as a percentage |
The Dashboard can optionally be switched to show all of this information for a specific link order to more closely monitor a particular part of the migration project.
It is also possible to show the extraction and ingestion speed in items per second, rather than items per hour.
Optionally, you can configure the pages widgets to display compressed sizes.
The dashboard provides an administrator with an overview of storage and other health parameters that may affect the migration being undertaken. If a problem is detected a yellow triangle will be visible in the user interface and a number. The number represents the number of problem types.
The page is divided into the following sections:
|
Section |
Description |
|---|---|
|
Modules |
Information relating to the status of modules. Those with issues will be shown with a warning symbol. Hover over those items and a tooltip will give more information. In addition this page shows details relating to any credentials which have been configured to be used by the system to access resources. These credentials are updated upon module restart. |
|
Storage Paths |
Shows information about the storage paths used by the system. |
|
Miscellaneous |
Any retention categories that are not mapped to a target environment are displayed here. |
|
Events |
Status events will be shown on this page. A list of events that may be displayed are described in the topic System Health Events. |
|
Sync |
Details relating to environment sync activities will be shown on this page. |
Free space on a staging area location is color coded as shown in the following table:
|
Highlighting |
Reason |
|---|---|
|
No highlighting |
Free space is above 100 GB |
|
Yellow |
Free space is below 100 GB |
|
Red |
Free space is below 50 GB |
In addition, the System Health page gives an overview of any modules that are deactivated or otherwise not running. This is shown at the top left of the screen in the Admin Interface.
If all available Office 365 licenses are already assigned and there is no available license left, on the Events tab on the System Health page displays a warning message.
The Link information at the bottom of the page also highlights the Used space on each link. Used space is defined as the used space from disk. This is also color coded for ease of identifying a potential problem, as follows:
|
Highlighting |
Reason |
|---|---|
|
No highlighting |
Used space is within normal parameters |
|
Yellow |
Used space is between 75% and 90% of the maximum allowed |
|
Red |
Used space is above 90% of the maximum allowed |
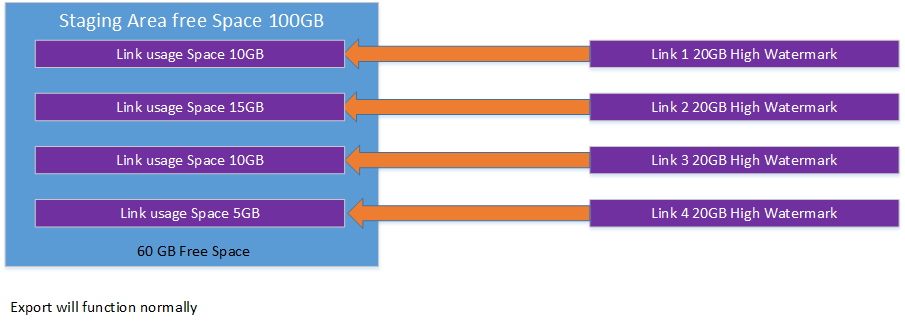
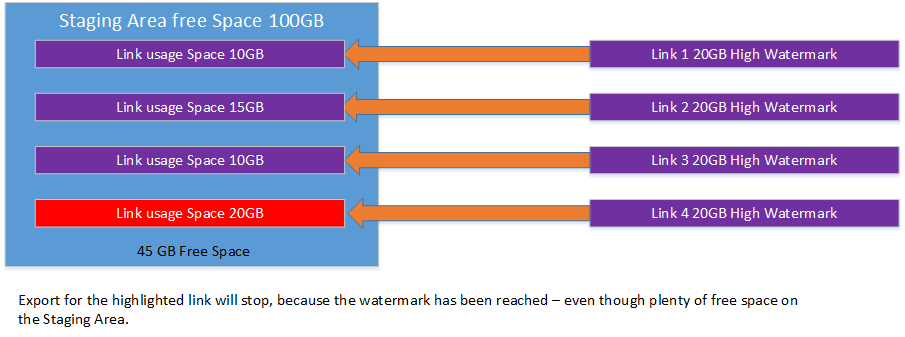
If the Used Space reaches 100% on a link, exporting of data will be stopped until data has been imported, even if there is still free disk space available on disk. This is further illustrated as follows:
|
|
NOTE: High and low watermarks can be adjusted from the Links page in the Archive Shuttle UI. |
The link information that is included also gives an indication of the indexing performance on the target (if the target is Enterprise Vault). The Index Incomplete column shows the number of items that are waiting to be indexed on the target environment. This information is updated once per minute by the EV Import module.
|
|
NOTE: If the Index Incomplete column shows a large value, it might indicate an issue with indexing in the target environment, which should be investigated. |
Actions to be performed on the System Health page
·Cleanup Staging Area: Issues a command to the Archive Shuttle modules to clean up the staging area of already imported files.
·Run Now: Run a scheduled task immediately.
The events tab on the system health page in Archive Shuttle reports issue that might impact a migration. This section explains the events that might be generated. The activities are checked when the system health page loads rather than at scheduled intervals. This ensures that the events which are shown are up to date.
|
Title |
Description | ||
|---|---|---|---|
|
Office 365 License Issue |
If the number of active licenses is more than the consumed plus suspended licenses a message will be shown. | ||
|
SourceOne index issue |
There is an index which is needed to greatly improve the migration from SourceOne. If SQL index is not found, a message is displayed. | ||
|
Cargo Bay issue |
If SQL Server Integrations Services (SSIS) 2017 is not installed, then Cargo Bay will not work and a message will be displayed. | ||
|
Folderless item setting |
If the system configuration does not have the Folderless Item setting configured, then a message is displayed. To resolve the issue, set the Folderless Item entry in the System Configuration. | ||
|
License validity |
If the current license is not valid, a message is displayed. | ||
|
License issue |
If there is some other problem with the current license, a message is displayed. | ||
|
Mailbox quota issue |
If you have exceeded the limit specified in the setting Mailbox Quota Exceeding Threshold (%), which you can set by going to System Configuration > Office 365 Module > General, a message will be displayed. Clicking on this error will bring you to the Container Mapping Health page, which has additional information.
|