Auditing Compliance Actions
The lists actions taken on files scanned by Sensitive Content Manager over a specified date range.
To generate a Compliance Actions Audit:
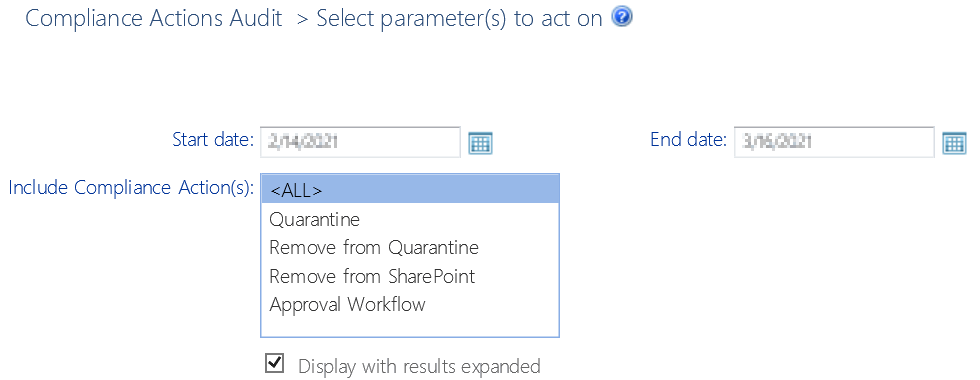
1Select the object(s) you want to include in the audit.
2Choose Compliance > Compliance Actions Audit.
3Specify the parameters for your analysis.
Now you can:
·run the operation immediately (by clicking the [Run Now] button)
OR
·schedule the operation to run at a later time or on a recurring basis.
OR
·save the operation as XML Instructions that can be run at a later time.
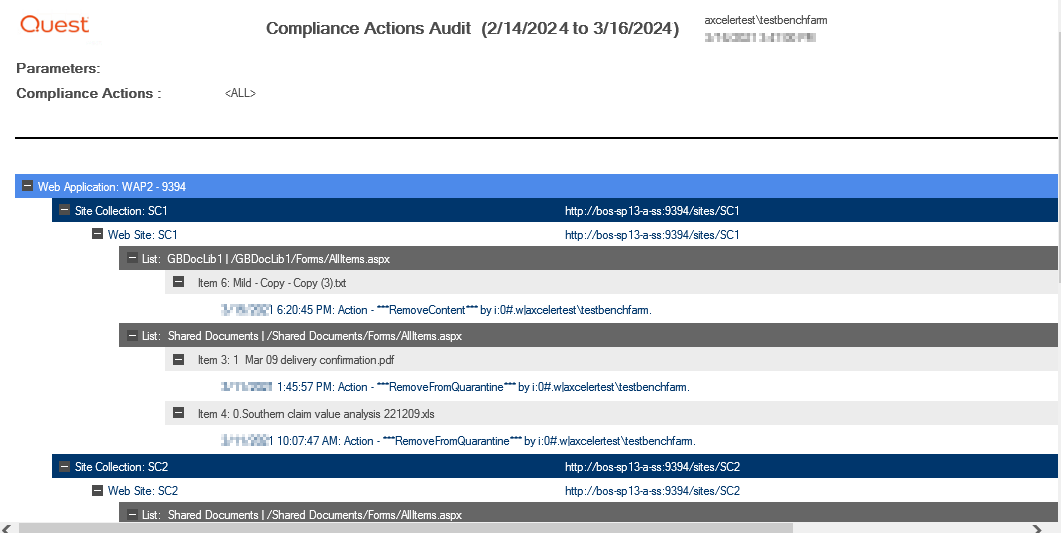
Results include each file within the scope of your analysis, grouped by site collection, along with the date the scan was performed, the action taken, and the account the action was taken by.
NOTE: For any scans performed prior to version 8.6, the "by" displays NA, as this information was not captured for Compliance reporting purposes in earlier versions of ControlPoint.
Note that for files with embedded items, only the parent item is included in the audit.
Reporting on Sensitive Files Activity
If you are a member of the ControlPoint Compliance Administrators group, you can use the ControlPoint Sensitive Files Activity report to view detailed information about files analyzed by Sensitive Content Manager that:
·have been identified as "sensitive content" (that is, have been assigned a Severity Level)
AND
·have been accessed by at least one SharePoint user.
NOTE: This report includes sensitive content identified both from bulk scans and as a result of the enforcement of ControlPoint Policies.
Before you can report sensitive files activity:
·Auditing must be enabled for each list or library for which you want to report sensitive activity. You can enable these settings for individual site collections from within SharePoint or, for a larger scope, using the ControlPoint Manage Audit Settings action.
·At least one Compliance scan must have been returned by Sensitive Content Manager with items that have been assigned a Severity Level.
To report sensitive files activity:
1Select the object(s) for which you want to report sensitive files activity.
2Choose Compliance > Sensitive Files Activity.
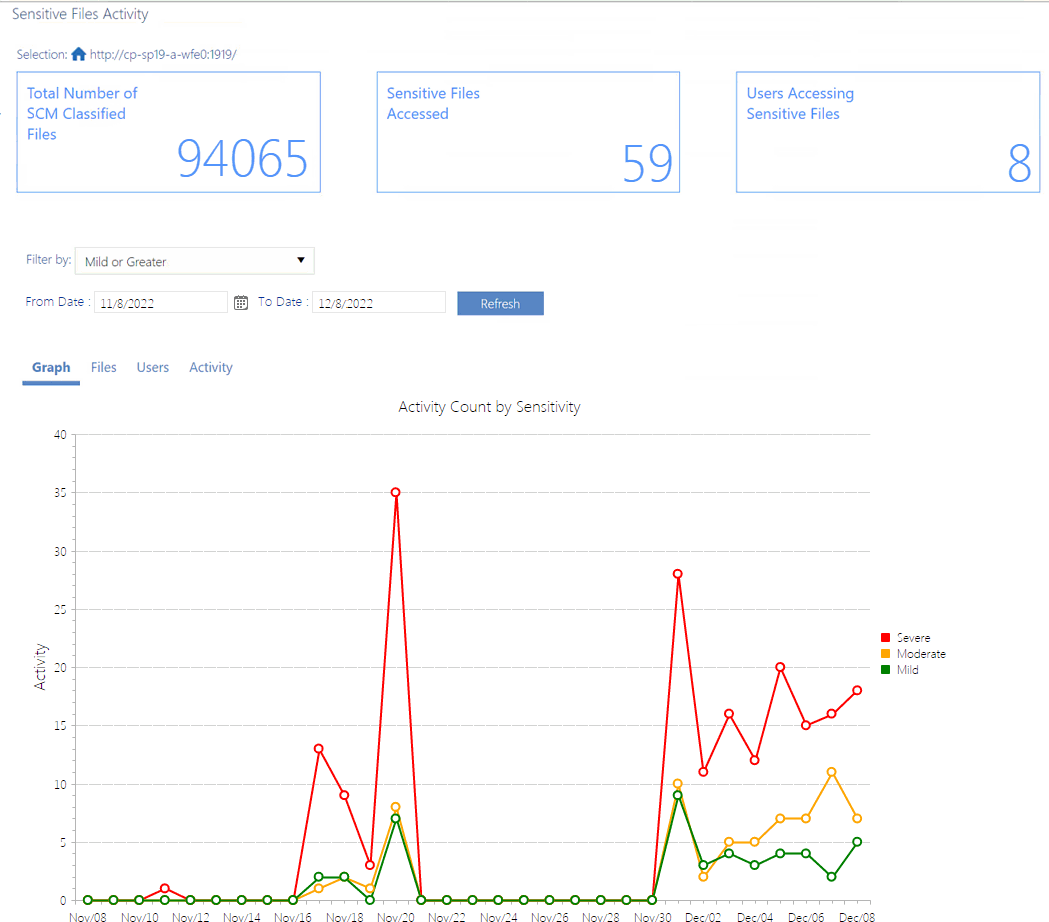
The tiles at the top of the report highlight the following statistics for the selected time period (by default, the past month):
·Total Number of SCM (Sensitive Content Manager) Classified Files
·Sensitive Files Accessed (that is, the number of times a file identified as having sensitive content has been accessed by a SharePoint user)
NOTE: The number of times the System Account has modified the Scan Results field for the item on the SharePoint list will be included in this value unless the Sensitive Content Manager Configuration Setting Add Scan Results Column to Scanned SharePoint List is set to false. Details can be found in the ControlPoint Administration Guide.
·Users Accessing Sensitive Files (that is, the number of unique SharePoint users who have accessed files identified as containing sensitive content)
·Realtime Scanning (that is, the number of days since the last bulk scan was performed)
To filter results that display in the body of the report:
1.Choose a different severity level from the Filter drop-down and/or modify the default date range.
2.Click [Refresh].
Graph Tab
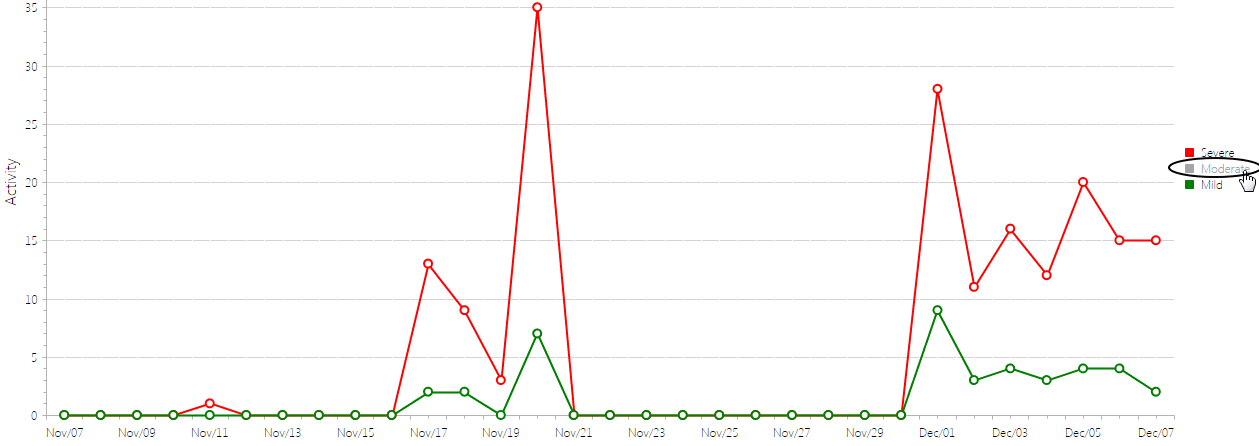
The Sensitive Files Activity report Graph tab illustrates the Activity Count by Sensitivity for the selected Severity Level(s) and date range.
Note that you can click a Severity Level in the legend at the right side of the page to hide/display it.
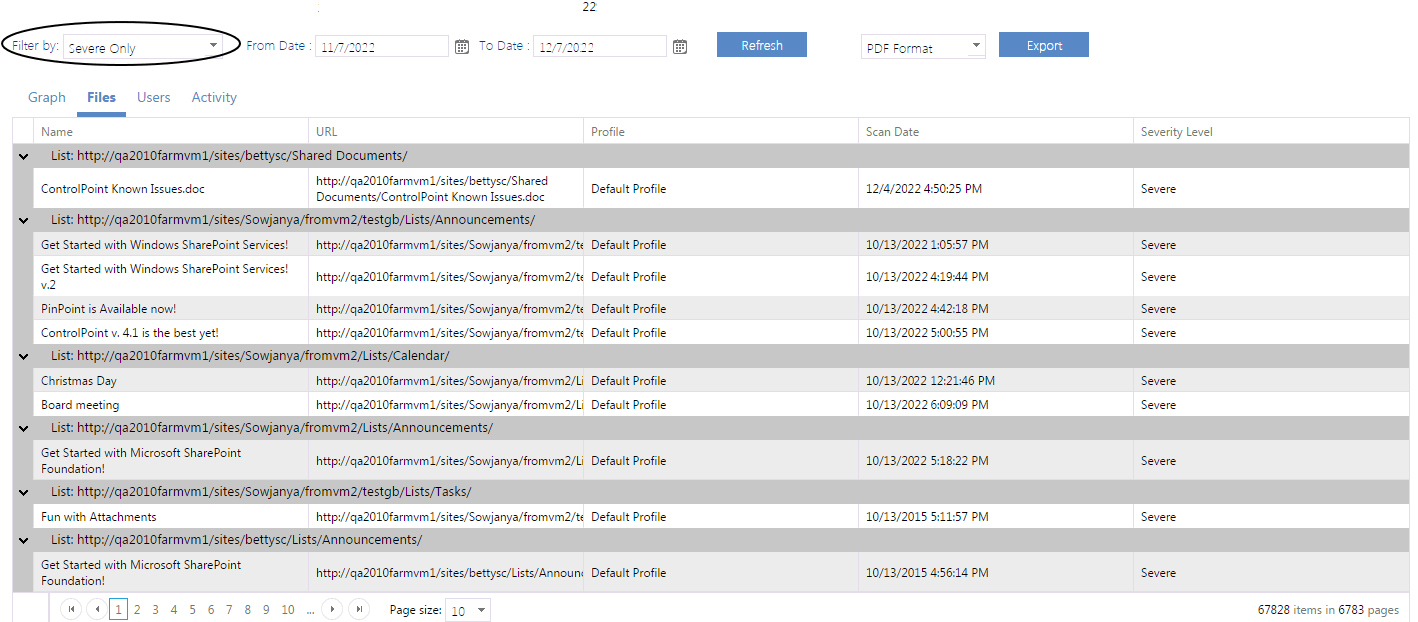
Files Tab
The Sensitive Filest Activity report Files tab lists all of the files the Content Sensitive Manager identified as "sensitive content" for the selected Severity Level(s), grouped by list or library.
Note that this tab displays all content sensitive classified files for the selected Severity Level(s), regardless of whether they have been accessed, and the date range filter does not apply.
Users Tab
The Users tab lists the SharePoint users who have accessed files with sensitive content within the specified time period, along with the Number of Files Accessed.
Activity Tab
The Activity tab lists each individual instance of sensitive content activity, including the User Name. Activity Type, file Severity Level and Activity Date.
Using ControlPoint Sentinel to Detect Anomalous Activity
ControlPoint Sentinel functionality enables you to detect deviations in document views and downloads from individual users' "typical" daily usage patterns. ControlPoint Sentinel uses the following components in its anomalous activity determinations:
·Business Hours: Daily start and end time for each day of the work week.
·The following Anomalous Activity Limits:
§Default daily activity limits: The limits for each (measured in terms of document views and downloads) to apply to any user whose personal activity limits have not yet been characterized.
§Personal daily activity limits: The deviation from "typical" daily usage patterns characterized for each individual user on a given day of the week.
ControlPoint Sentinel relies on SharePoint Audit Log events. Therefore, for this functionality to be effective, the auditing of Delete, Edit, and View/Download must be enabled for every site collection for which you want to collect activity data.
NOTE: Before ControlPoint Sentilel can be used, the ControlPoint Application Administrator must prepare the envronment. Refer to the ControlPoint Administration Guide for details.
How Personal Daily Activity is Determined
Anomalous activity limits are set based on the statistical analysis of how often each user views and downloads documents. The personal daily activity limits used by ControlPoint Sentinel are defined in terms of standard deviations above the mean or average observed over a period of time (currently, 12 days worth of observations for each day of the week).
Standard deviation is a statistical measure of the variation within a set of data values. Two users may have the same average of document views and downloads per day, but their standard deviation or the variation in the number of documents they view and download in any given day can be very different. If a user consistently views and downloads roughly the same number of documents every day, then their standard deviation will be low. If a user is more erratic in the number of documents they view or download in a day (for example, sometimes viewing or downloading no documents, sometimes one or two, sometimes 30 or 40) then their standard deviation will be high. By using an individual users standard deviation to define the limits for anomalous activity the limits are tailored to each users usage pattern.
Using the users standard deviation we can determine how likely it is that a user would view or download a particular number of documents in a day. When looking for anomalous activity we are looking at activity that is not very likely, that should happen much less than 1% of the time. For highly anomalous activity we are looking for activity that should happen a very small fraction of a percentage of the time.

