|
• |
If Monitor All is selected in the Select IaaS Virtual Machines to Monitor dialog box: In the Edit Properties dialog box, select Select Resource Groups to be monitored, and then ensure every agent monitors various Resource Groups. |
|
• |
If Monitor All and Automatically Monitor New Virtual Machines are not selected in the Select IaaS Virtual Machines to Monitor dialog box: In the Edit Properties dialog box, ensure every agent monitors various virtual machines. |
|
• |
If Monitor All is not selected but Automatically Monitor New Virtual Machines is selected in the Select IaaS Virtual Machines to Monitor dialog box: In the Edit Properties dialog box, select Select Resource Groups to be monitored, and then ensure every agent monitors various Resource Groups. |
If you still encounter problems, contact Quest Support.
|
3 |
|
4 |
|
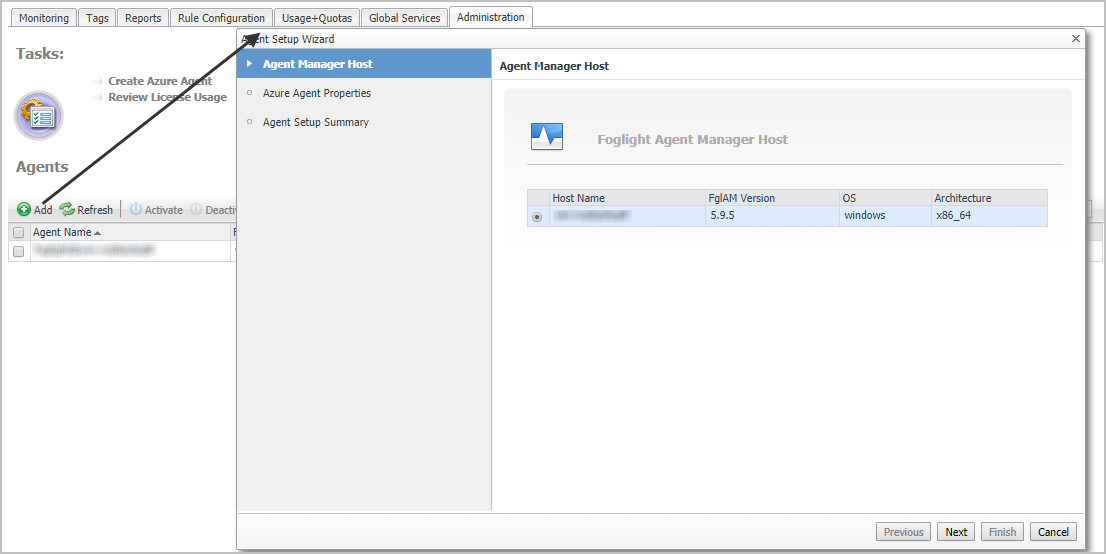
5 |
In the Agent Manager Host view, select the agent manager on which the new agent is to be deployed, and then click Next. |
|
6 |
|
• |
Azure Environment*: The value of Azure Environment: Azure.com (default value) or Azure.cn(China). |
|
• |
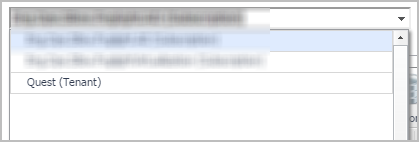
Tenant Directory ID *: The value of Tenant ID retrieved in Getting authentication information through Azure portal. |
|
• |
Tenant Alias Name: The display name that identifies your Tenant. |
|
• |
Application ID *: The value of Application ID retrieved in Getting authentication information through Azure portal. |
|
• |
Access Key *: The value of Access Key retrieved in Getting authentication information through Azure portal. |
|
• |
Specify an agent name (Optional): Specify the name of agent. |
|
• |
Configure Proxy (Optional): Configure the proxy setting when the Agent Host requires a proxy connection to the Internet. For more details, see Configure Proxy (Optional): . |
|
7 |
After installing Foglight Hybrid Cloud Manager for Azure, the Cloud Manager entry appears under Homes.
|
3 |
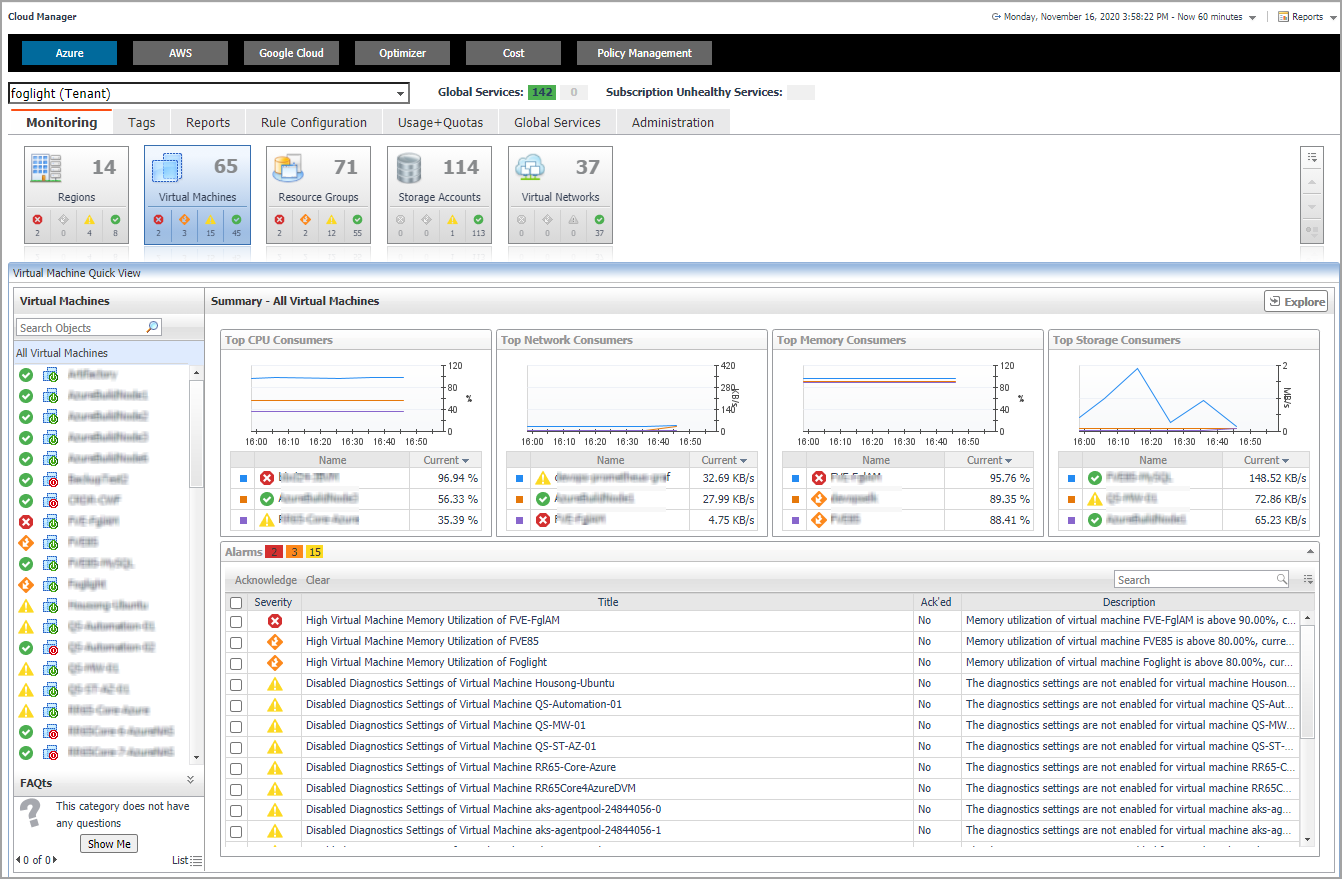
The Cloud Manager dashboard consists of the following UI elements:
|
• |
The actions bar at the top of the Cloud Manager dashboard contains: the Monitoring Tab, the Tags Tab, the Reports Tab, the Rule Configuration Tab, the Global Services Tab, and the Administration Tab.