Tchater maintenant avec le support
Tchattez avec un ingénieur du support

KACE Systems Management Appliance 14.0 Common Documents - KACE Service Desk Administrator Guide

About the KACE Service Desk Getting started
Configuring the appliance
Requirements and specifications Power-on the appliance and log in to the Administrator Console Access the Command Line Console Tracking configuration changes Configuring System-level and Admin-level General Settings Configure appliance date and time settings Managing user notifications Enable Two-Factor Authentication for all users Verifying port settings, NTP service, and website access Configuring network and security settings Configuring session timeout and auto-refresh settings Configuring locale settings Configuring the default theme Configure data sharing preferences About DIACAP compliance requirements Configuring Mobile Device Access Enable fast switching for organizations and linked appliances Linking Quest KACE appliances Configuring history settings Configuring Content Security Policy
Setting up and using labels to manage groups of items Configuring user accounts, LDAP authentication, and SSO Deploying the KACE Agent to managed devices Using Replication Shares Managing credentials Configuring assets
About the Asset Management component Using the Asset Management Dashboard About managing assets Adding and customizing Asset Types and maintaining asset information Managing Software assets Managing physical and logical assets Maintaining and using manual asset information Managing locations Managing contracts Managing licenses Managing purchase records
Setting up License Compliance Managing License Compliance Setting up Service Desk Configure the Cache Lifetime for Service Desk widgets Creating and managing organizations Importing and exporting appliance resources
Managing inventory
Using the Inventory Dashboard Using Device Discovery Managing device inventory
About managing devices Features available for each device management method About inventory information Tracking changes to inventory settings Managing inventory information Finding and managing devices Registering KACE Agent with the appliance Provisioning the KACE Agent Manually deploying the KACE Agent Using Agentless management Adding devices manually in the Administrator Console or by using the API Forcing inventory updates Managing MIA devices Obtaining Dell warranty information
Managing applications on the Software page Managing Software Catalog inventory
About the Software Catalog Viewing Software Catalog information Adding applications to the Software Catalog Managing License assets for Software Catalog applications Associate Managed Installations with Cataloged Software Using software metering Using Application Control Update or reinstall the Software Catalog
Managing process, startup program, and service inventory Writing custom inventory rules
Deploying packages to managed devices
Distributing software and using Wake-on-LAN Broadcasting alerts to managed devices Running scripts on managed devices Using Task Chains
Patching devices and maintaining security
Using the Security Dashboard About patch management Subscribing to and downloading patches Creating and managing patch schedules Managing patch inventory Managing Windows Feature Updates Managing Dell devices and updates Managing Linux package upgrades Manage quarantined file attachments
Using reports and scheduling notifications Monitoring devices
Getting started with monitoring Working with monitoring profiles Managing monitoring for devices Working with alerts
Using the Service Desk
Configuring Service Desk Using the Service Desk Dashboard Managing Service Desk tickets, processes, and reports
Overview of Service Desk ticket lifecycle Creating tickets from the Administrator Console and User Console Creating and managing tickets by email Viewing tickets and managing comments, work, and attachments Merging tickets Using the ticket escalation process Using Service Desk processes Using Ticket Rules Run Service Desk reports Archiving, restoring, and deleting tickets Managing ticket deletion
Managing Service Desk ticket queues About User Downloads and Knowledge Base articles Customizing Service Desk ticket settings Configuring SMTP email servers
Maintenance and troubleshooting
Maintaining the appliance Troubleshooting the appliance
Appendixes Glossary About us Legal notices

Search for alerts using Filter criteria

Search for alerts using Filter criteria

Advanced Page-level Search enables you to search for information on the current page using various combinations of criteria.

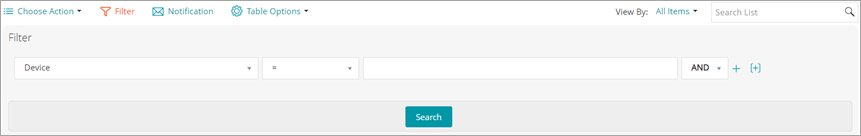
This example shows how to use Filter to find critical alerts related to a connection issue.

1.
Go to the Monitoring Alerts list page in one of the following ways:
If you have the Monitoring Alerts widget installed on your open Dashboard, click Monitoring Alerts.
2.
Click Filter on the right, above the Monitoring Alerts list.
The Filter panel appears.

4.
With AND selected in the operator drop-down list, click to add a new line, then specify the criteria required to find alerts that contain Unable to connect in the message:
5.
Click Search.

The list is refreshed to show devices that match the specified criteria.

Filtering alerts using the Include Text and Exclude Text capability

Filtering alerts using the Include Text and Exclude Text capability

If you are receiving too many alerts of a certain type, or if you want to track a particular alert, you can filter alerts based on the message text and severity level.

You can exclude specific events from being raised as alerts if you find them unnecessary or distracting. To filter the alerts you do not want to receive, you use Exclude Text to indicate the content that identifies an unwanted alert. Use Exclude Text in conjunction with Include Text to refine a subset of an alert category.

There are two methods for filtering alerts from being reported by the monitoring feature. One entails working in the Profile Details page and the other entails using the Choose Action drop-down menu from the Monitoring Alerts list page.

Filter alerts using the Include Text and Exclude Text capability from the Profile Details page

Filter alerts using the Include Text and Exclude Text capability from the Profile Details page

You can filter the alerts you receive based on the message text and severity level.

Use Exclude Text in conjunction with Include Text to refine a subset of an alert category.

NOTE: The criteria match text, for example, error, is matched in Windows event logs against both the severity level and the message itself.
1.
Go to the Profiles list page:
a.
Log in to the appliance Administrator Console, https://appliance_hostname/admin. Or, if the Show organization menu in admin header option is enabled in the appliance General Settings, select an organization in the drop-down list in the top-right corner of the page next to the login information.
b.
On the left navigation bar, click Monitoring, then click Profiles.
2.
Select the check box for the existing profile that you want to edit, and select Choose Action > Edit to display the Profile Detail page.
3.
Make changes to the include and exclude Criteria settings, as needed.
Change Include Text.
Change Exclude Text.
If necessary, select Yes in the Case-sensitive drop-down list.
1.
On the Criteria category header, click the Add button: .
4.
Click Save at the bottom of the page.

Filter alerts using the Exclude Text capability from the Monitoring Alerts list page

Filter alerts using the Exclude Text capability from the Monitoring Alerts list page

If you are receiving too many alerts of a certain type, you can filter them based on the message text.

You can use full messages, parts of messages, and basic regular expressions in the Exclude Text field to define criteria for filtering the alerts you receive.

1.
Go to the Monitoring Alerts list:
a.
Log in to the appliance Administrator Console, https://appliance_hostname/admin. Or, if the Show organization menu in admin header option is enabled in the appliance General Settings, select an organization in the drop-down list in the top-right corner of the page next to the login information.
If you have the Monitoring Alerts widget installed on your open Dashboard, click Monitoring Alerts.
3.
Select Choose Action > Filter Alerts Like This.
The Filter Alerts Like This dialog appears, with the content of the alert message populating the Exclude Text field.
4.
Edit text in the Exclude Text field to refine the filter.

Example: To raise alerts for disk errors except for those errors for a fragmented disk, you could enter the following:

Include Text entry

Exclude Text entry

Error code.*Disk /dev/sd[a-z]

is fragmented

5.
Click Save.
Documents connexes

The document was helpful.

Sélectionner une évaluation

I easily found the information I needed.

Sélectionner une évaluation